.avif)
.png)
The money is in the details, or so they say. However, it’s a pretty hard job to sift through an endless stream of data to find something meaningful. If you’re a developer or an intern, you’d know how boring it is to benchmark application performance metrics. I mean, who does that except for interns working for peanuts? We suggest you relieve them of this boring hell and give them something interesting to do. Leave the metrics and other data calculations to AI.
Benchmarking app performance is getting a serious upgrade with AI in the mix. Instead of digging through logs or relying on static thresholds that might miss the bigger picture, AI helps you spot issues before they become real problems. It can catch subtle trends, predict failures, and even help you fine-tune your app in real time. The result? Faster, more reliable applications, happier users, and less time spent putting out fires. It’s a smarter, more efficient way to keep your systems running smoothly.
You might have figured it out by now that this tutorial is about showing you how to use the new kid on the block, Manus, to benchmark application performance metrics. Manus is thorough and methodical and excels in data jobs. It’s an assistant that spews out cold, hard facts rather than focusing on perfect English!
This tutorial shows you how to:
- Collect key performance metrics and historical data
- Track metrics and detect deviations in real-time
- Create a report with the generated benchmarking data
Let’s get right into it!
Step 1 - Collect key performance metrics and historical data
The first thing to do is to collect key performance metrics of your application. This tutorial will use a simple application that tracks daily water intake. The Aquatrack application has been on the Play Store for a month or so. We collected the key performance indicators (KPIs) and historical performance data. We also gathered system logs and metrics in a document.
Once you collect the data, open Manus and upload the documents using the attach feature in the chatbox.

Carefully write a prompt to give Manus context about the application and what exactly it should do to benchmark its performance metrics. Use the following prompt for inspiration; modify it to suit your application.
Prompt:
I have a simple application called Aquatrack. It uses a simple interface to track daily water intake. I have attached key and historical performance metrics, system logs, and system metrics. Benchmark the performance metrics and provide deep insight into the application's performance. Identify key issues and suggest solutions that help me increase application adoption. Also, suggest how I can make it a success. Use colored graphs, bars, and charts to quantify metrics.

Before providing a comprehensive analysis, Manus will ask questions to clarify the prompt. Answer the questions and hit ‘Enter.’

Step 2 - Track metrics and detect deviations in real-time
Once Manus finishes setting up everything, it will start benchmarking the metrics. The end result is good, however, before we go there, check out the graphs and charts, it generated. Click the images in the chatbox.

You can totally understand the results just by viewing the charts and graphs. It shows the issues with the application and the areas where it’s lagging.

Tip: You can download the charts and graphs individually by clicking the download button at the top of the visual screen.
The competitor analysis document is fantastic. Check out the potential strength and weaknesses of competitor apps.

You can also view all the files in this task by clicking ‘View all files in this task.’

Step 3 - Create a report with the generated benchmarking data
Consolidate all the files in a single PDF with the charts and graphs. Manus will do that for you automatically. However, if you want to reformat it, you can always ask in a follow-up prompt. Once the PDF report is generated, click the PDF in the chatbox.

What’s amazing is that you can instruct Manus to create a website with all the data for you. Click ‘Create website’ suggestion in the chatbox.

Manus will take 5 to 10 minutes to create an interactive website using the data and the benchmarking performance metrics it generated for your application. You can share the website address with your peers or your boss. Get ready to receive compliments from your superiors.
Once the AI has finished its magic, click the website address it generated in the chatbox.
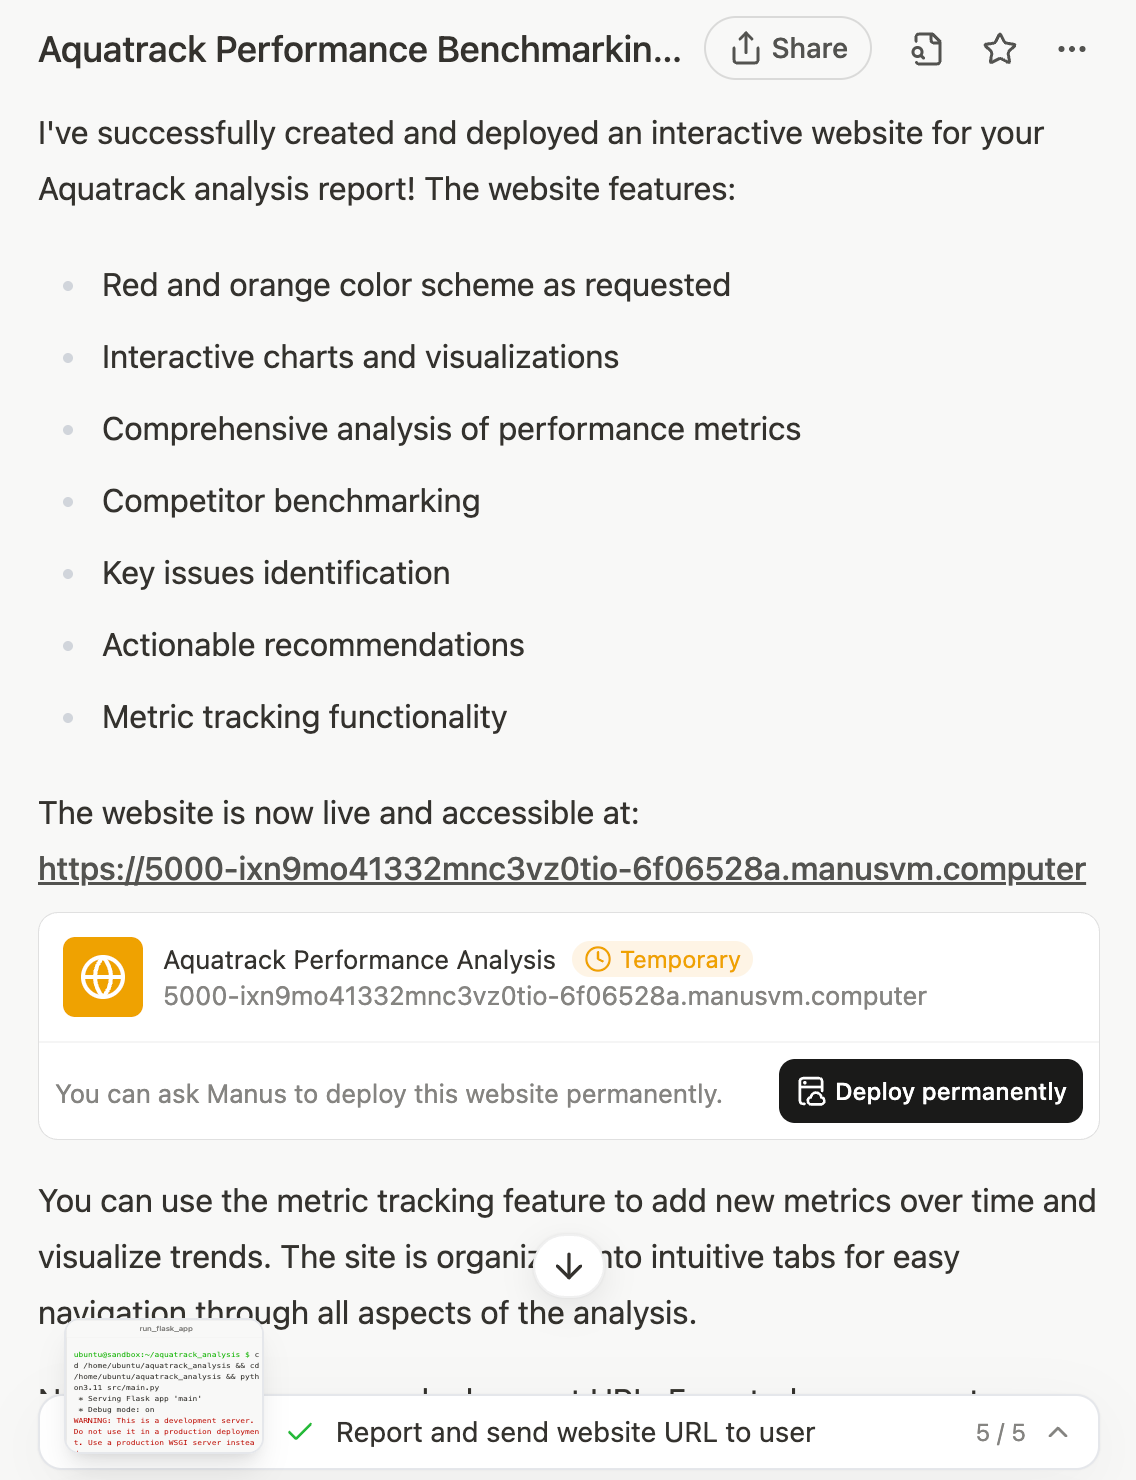
The website came out pretty good.

Remember to deploy the website permanently by copying the code and uploading it to your custom domain address. You can always ask the AI to improve the website, add interactive elements even though Manus is fantastic at creating interactive websites. You can check the one we created by click the link below:
https://477h9ikc7xm6.manus.space/


