.avif)

Ever stared at a blank spreadsheet, wondering how to transform those rows and columns into something actually worth looking at? What if your data could tell compelling stories without hours of manual formatting and formula-wrangling?
Canva's Visual Suite 2.0 is transforming the spreadsheet game with AI-powered features that not only fill your cells automatically but also surface insights you might have missed. It's like having a data scientist and designer collaborating inside your browser, turning mundane numbers into meaningful visualizations that capture attention and drive decisions. Say goodbye to spreadsheet dread and hello to data that practically presents itself!
This tutorial is going to be an exciting one because we’ll show you how to use Canva Sheets to create and customize a template, populate data automatically using Magic Fill, and generate insights with Magic Insights. You’re in for an exciting ride!
By the end of this tutorial, you’ll be able to:
- Access Canva Sheets
- Select and customize the template
- Use Magic Fill to populate data automatically
- Use Magic Insights for deep analysis
Let’s get started right away!
Step 1 - Access Canva Sheets
Head over to Canva and log in to your account (create one if you haven’t already done so).
After logging in, click the ‘Worksheet’ icon at the top of the page.

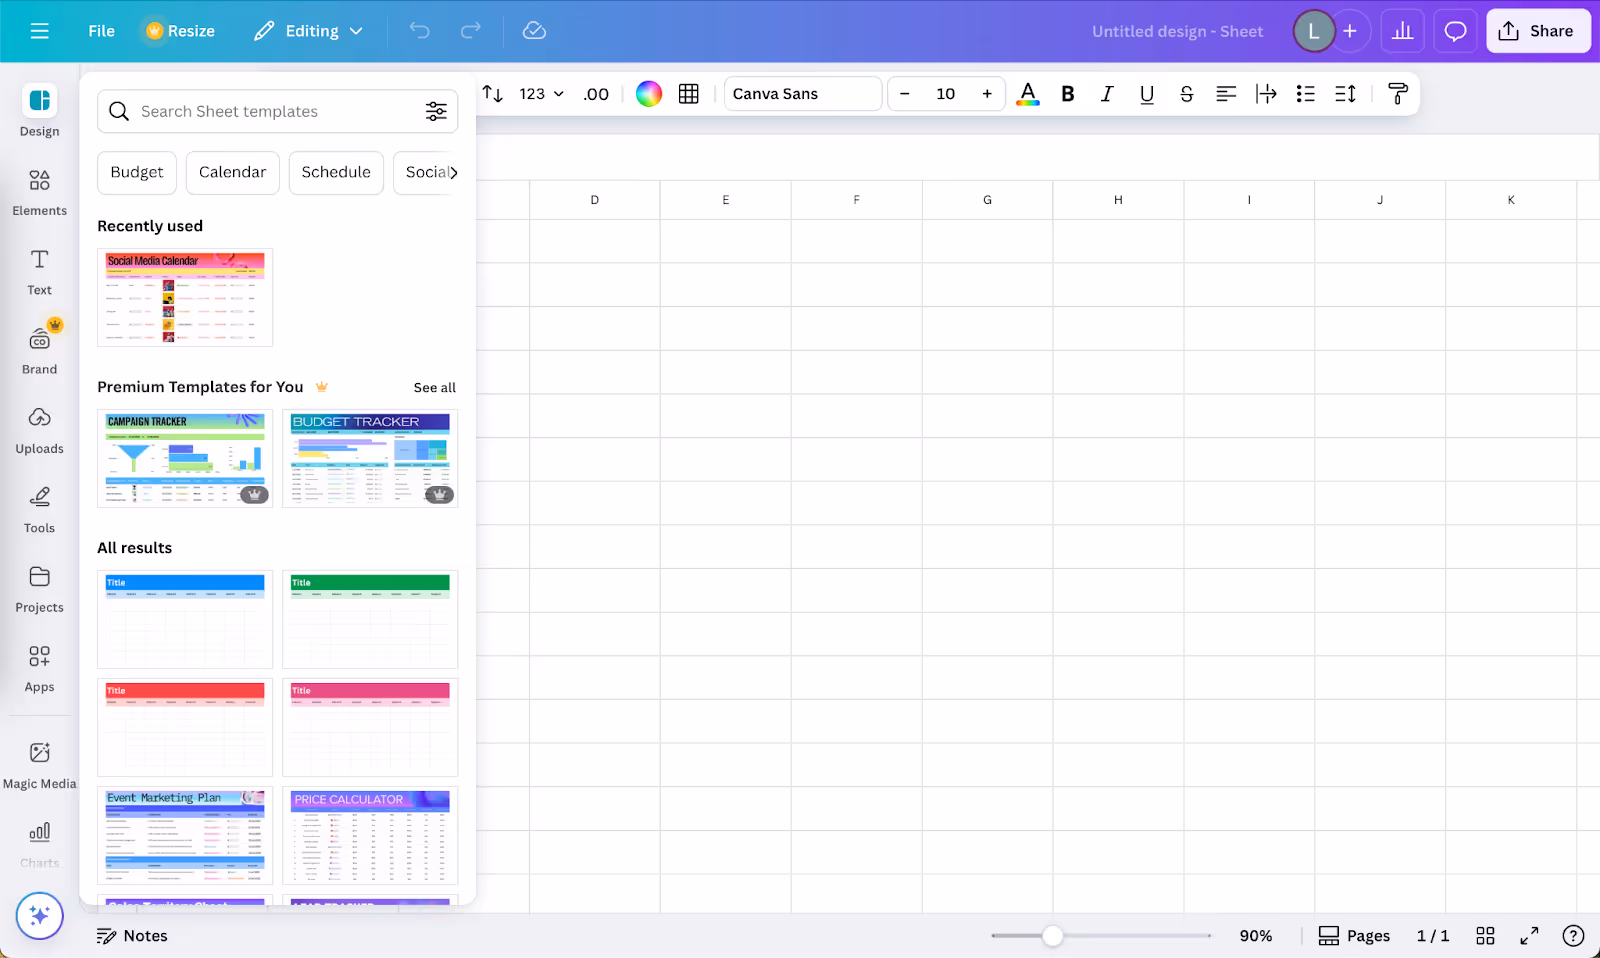
When you're in the Sheets section, you've got two choices: either kick things off with a fresh, empty spreadsheet or pick one of the ready-made templates. They're organized into convenient categories, such as "Calendar," "Budget," "Social Media," and more.
Important note: Canva Sheets are available only on subscription. It is not available in the free plan. To use Canva Sheets, you must subscribe to their monthly plan.
Step 2 - Select and customize the template
You can always start with a blank sheet and format it as needed. For this tutorial, we will use a template because it is easy and most users prefer templates over starting with a blank sheet. Take a look through the available templates and pick one that fits your needs. For instance, we’ll go with the “Social Media Calendar” template as an example.
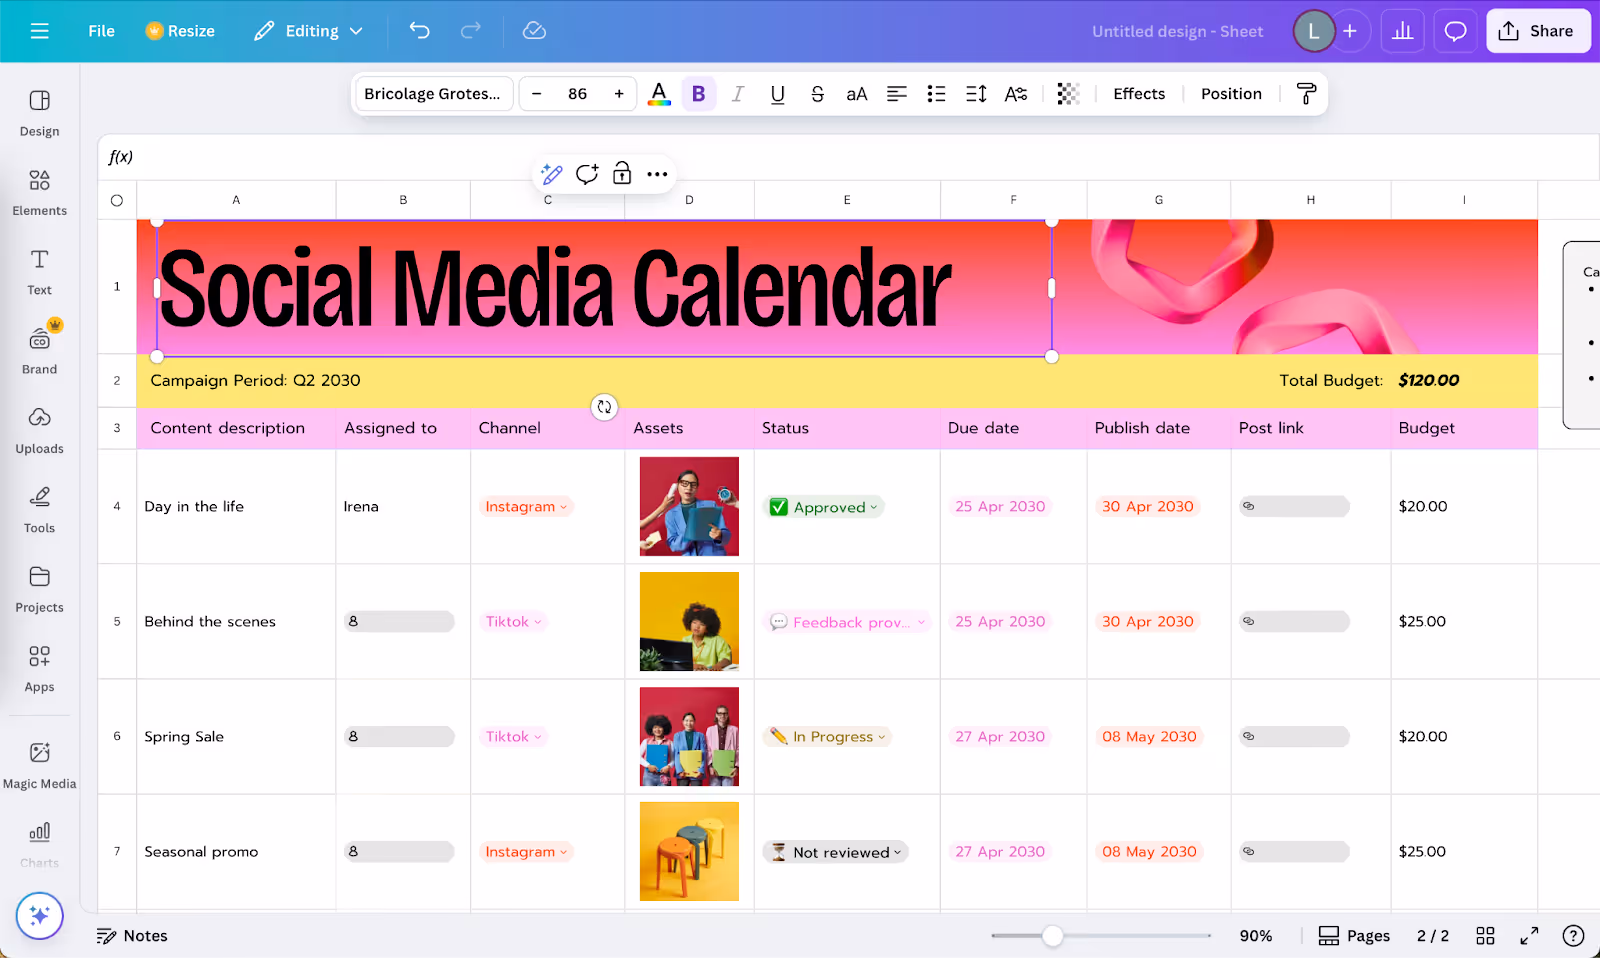
Once you’ve selected a template, you’ll land in the Sheets editor. From here, you can start customizing—add your own data, resize columns, and tweak the cell formatting. The interface is user-friendly and should feel familiar if you’ve used other spreadsheet tools before.
Step 3 - Use Magic Fill to populate data automatically
One standout feature in Canva Sheets is Magic Fill. It’s an AI-powered tool that helps you quickly fill in data patterns across your spreadsheet, saving you time and cutting down on manual work.
Let’s populate the sheet with some sample data to use Magic Fill. Establish a pattern, for example, add a few entries with dates, content descriptions, and platforms.
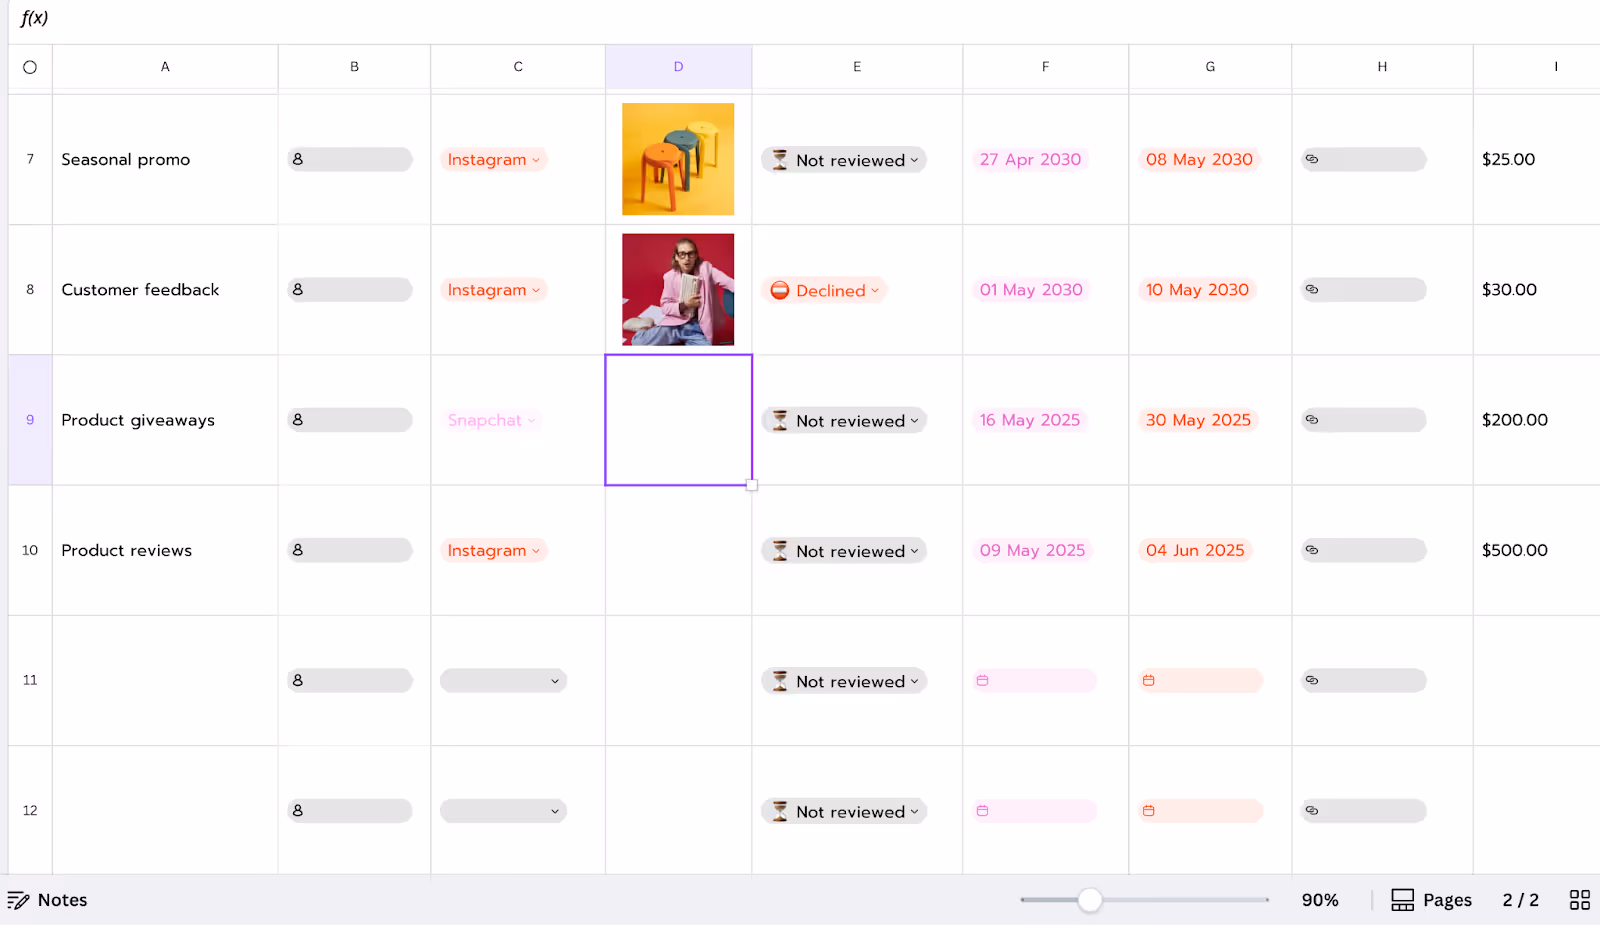
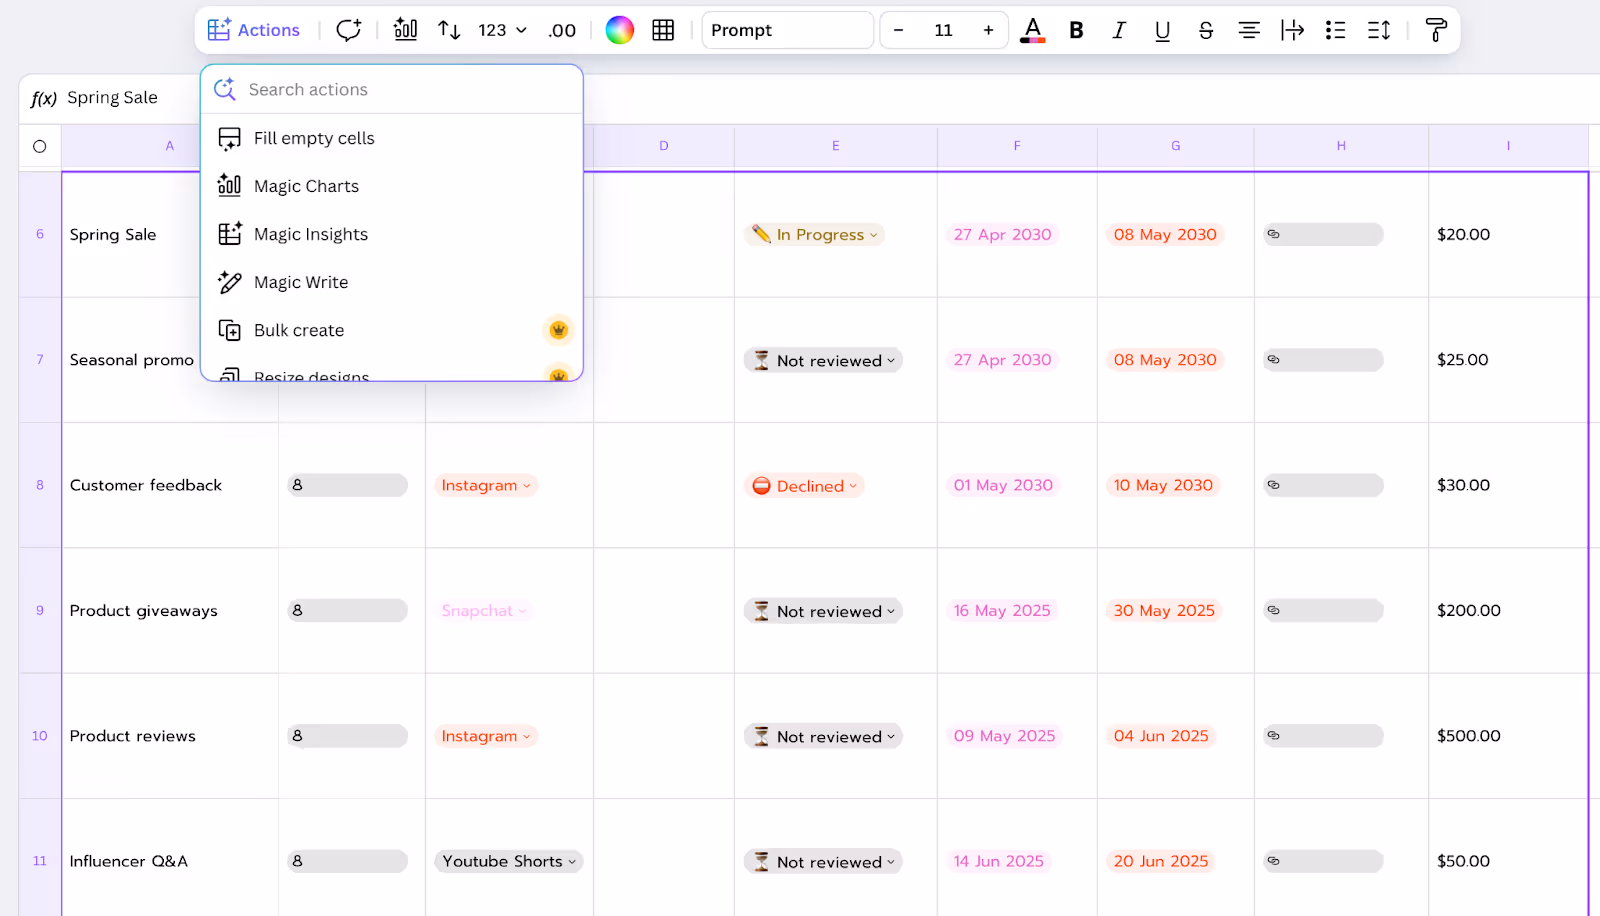
Now select the cells you want to fill, including both filled and empty cells, and click the ‘Fill empty cells’ in the actions drop-down menu. The content will be generated. Click ‘Insert’ to fill the cells.
Magic Fill looks at the data you’ve already entered and smartly fills in the blanks by spotting patterns and context. It’s especially handy for tasks such as auto-completing date sequences, repeating content types, or completing partial data sets.
Step 4 - Use Magic Insights for deep analysis
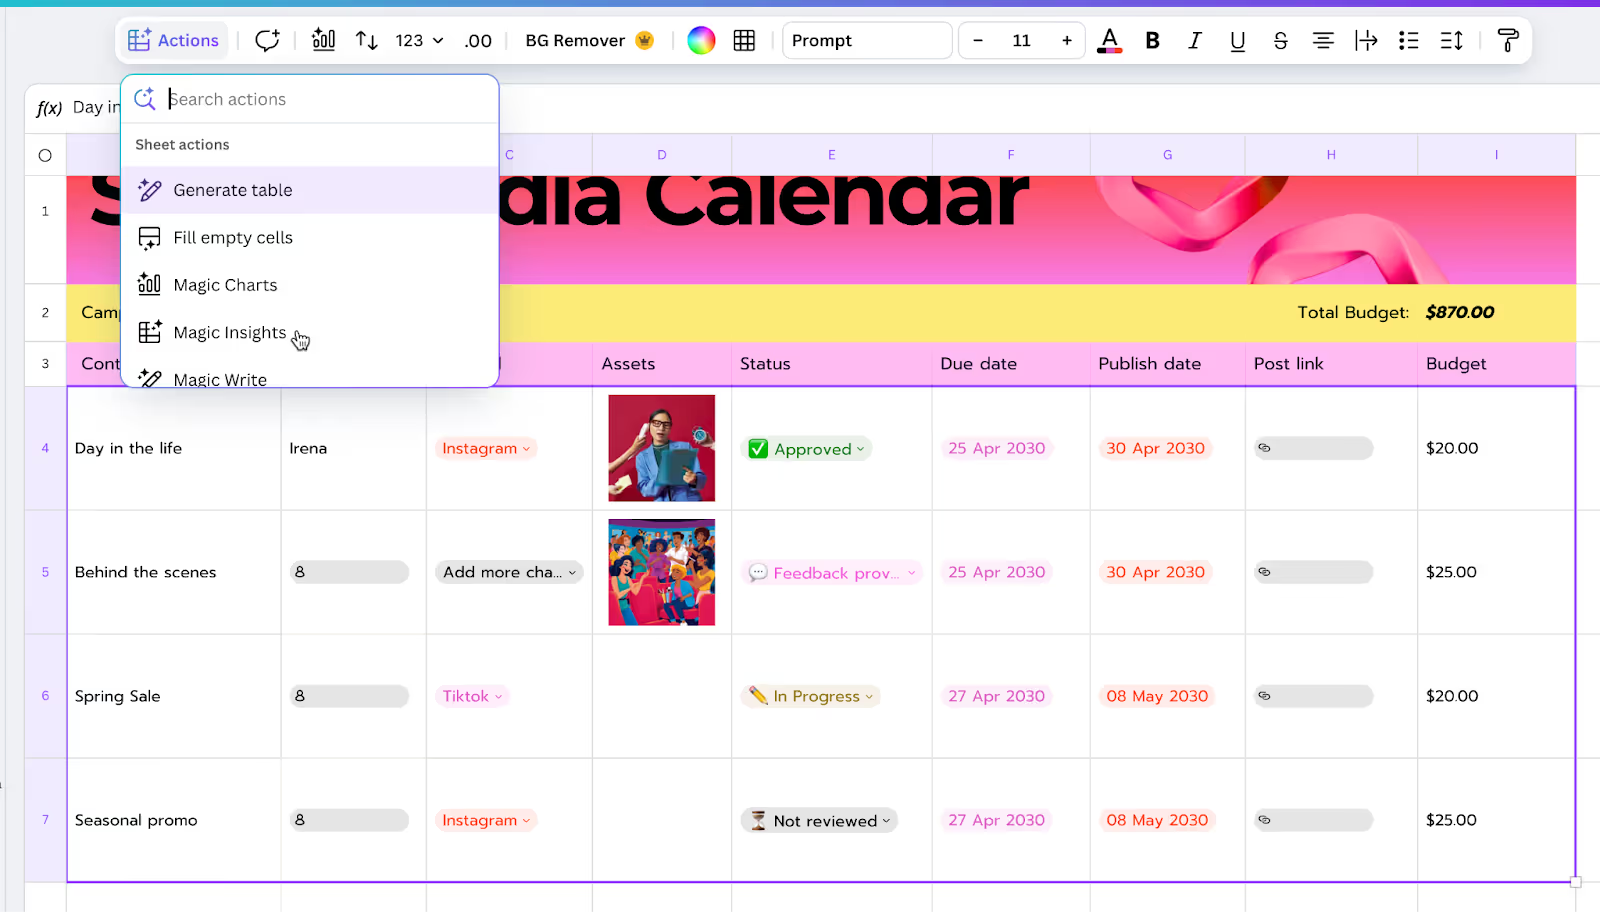
Another great feature is Magic Insights—it helps you make sense of your data more easily. To use it, just highlight the range you want to analyze, then hit the “Magic Insights” button in the Actions drop-down menu.
Once you click on Magic Insights, a sidebar will pop up where you can ask specific questions about your data. For instance, you could type “What’s my total budget?” or “How’s content performing by platform?” The tool will then dig into your data and give you clear summaries, visuals, and key takeaways based on what you asked.
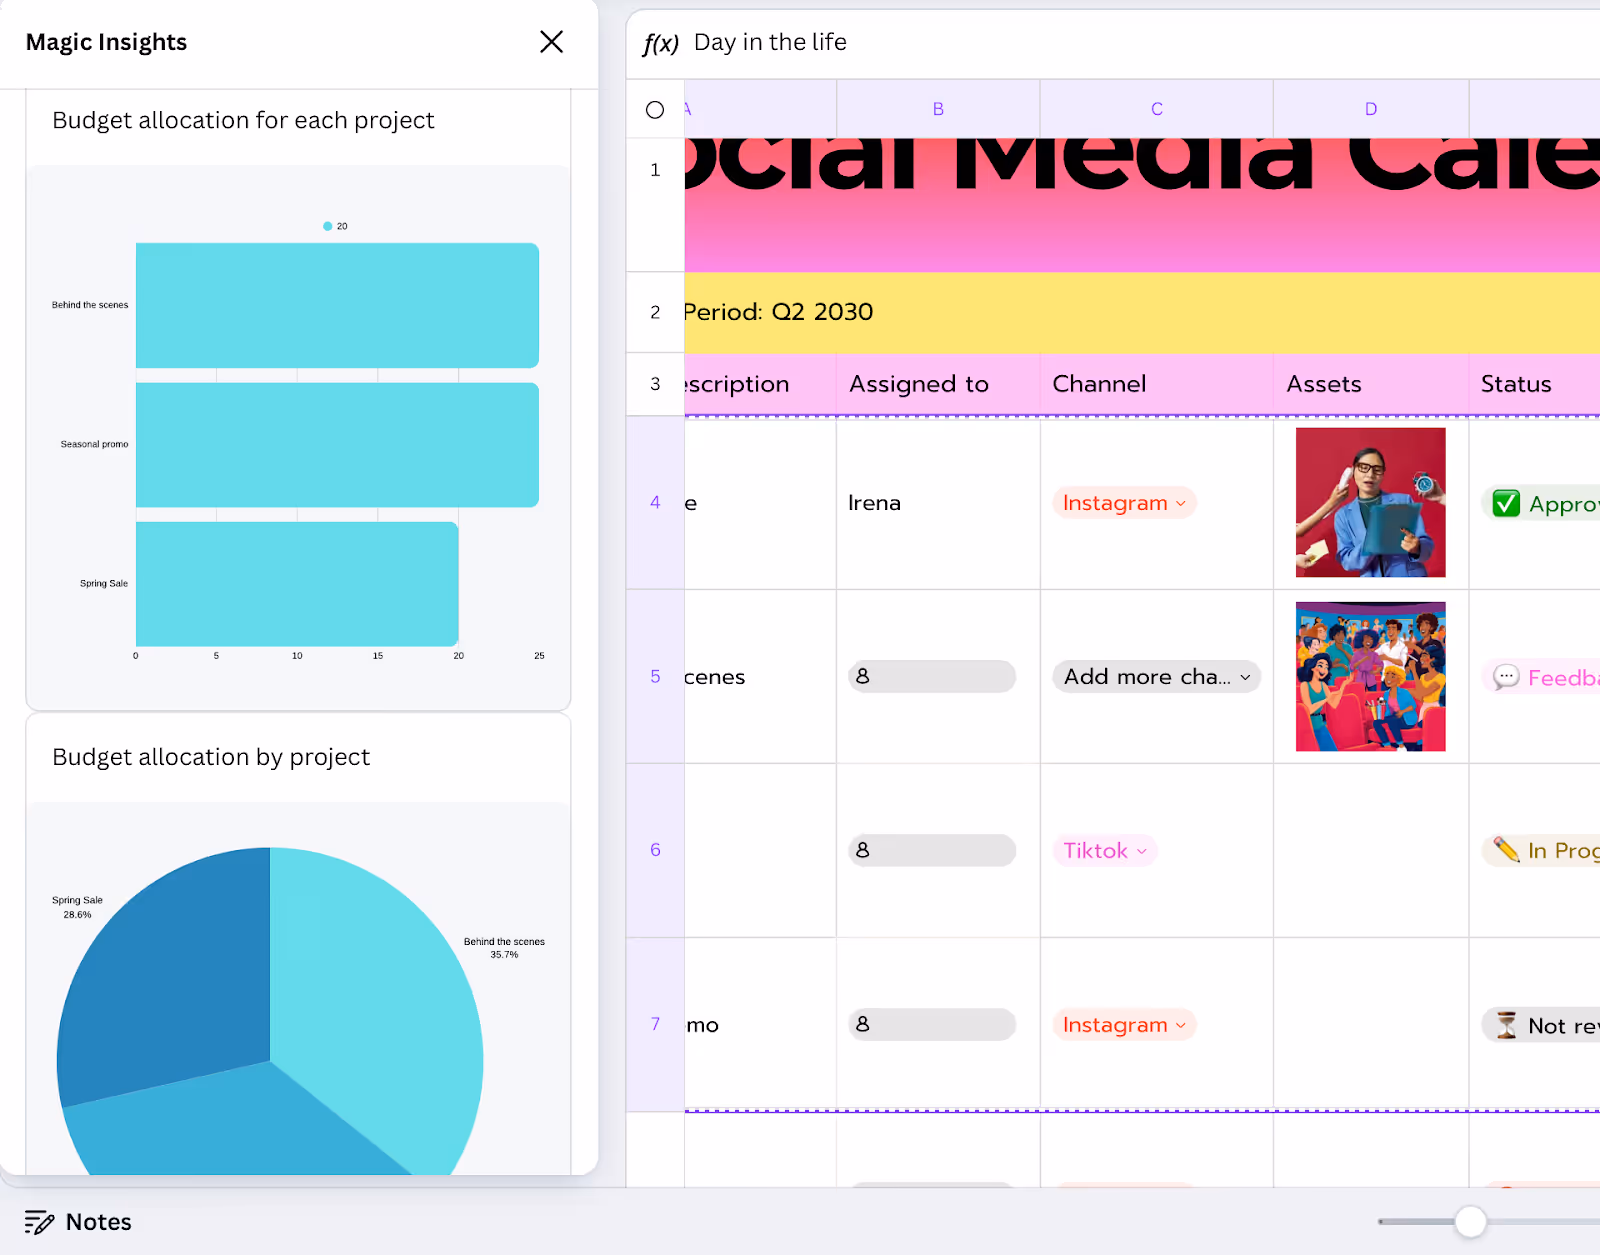
Magic Insights is especially useful for spotting trends, identifying outliers, and making wise decisions—all without having to build complicated formulas or charts yourself.
Try using Magic Fill and Magic Insights together. For example, you can use Magic Fill to auto-complete your content calendar for the next quarter, then switch to Magic Insights to see which types of content are likely to perform best based on past data. It’s a powerful combo for working smarter, not harder.
That’s it for this exciting tutorial, folks. Remember to use the magic feature of the Canva sheets. It will save you a lot of time and hassle.

.png)

.png)