.avif)
.png)
Financial tasks are complicated and have complex workflows. Between fragmented tools, manual checks, and constant edge cases, even experienced finance professionals end up juggling spreadsheets late at night and questioning their life choices by 40. The problem is not a lack of skill; it is the way these workflows are designed and maintained.
In the age of AI, finance remains one of the most overlooked areas, even though its workflows are among the most complex. Until truly specialized tools become mainstream, you can rely on ChatGPT to handle much of the heavy lifting. Beyond basic tasks like filling spreadsheets, running calculations, or writing formulas, the prompts in this tutorial show how to streamline your company’s finances while freeing up time for work you actually enjoy. And the best part is that it does not require dedicated hires or a five-figure salary. All you need is a $20 per month ChatGPT subscription, this tutorial, and a few smart automation tricks to build a finance assistant that works for you.
In this tutorial, we are going to share some neat prompts to help you fine-tune your finances. We are going to show you how to perform forecasting and scenario planning, create KPI dashboards, forecast cash flow, optimize working capital, analyze cost structures, monitor covenants, and benchmark operational efficiency.
In the end, you will know how to:
- Gather the financial documents and upload them to ChatGPT
- Perform forecasting and scenario planning
- Create KPI dashboards
- Forecast cash flow
- Optimize working capital
- Analyze cost structures
- Monitor covenants
- Benchmark operational efficiency
- Create a finance policy draft
Let’s get into it!
Gather the financial documents and upload them to ChatGPT
The first step is to gather the financial documents you want to use for these prompts. Log in to your ChatGPT Pro account and upload these documents to a new chat.

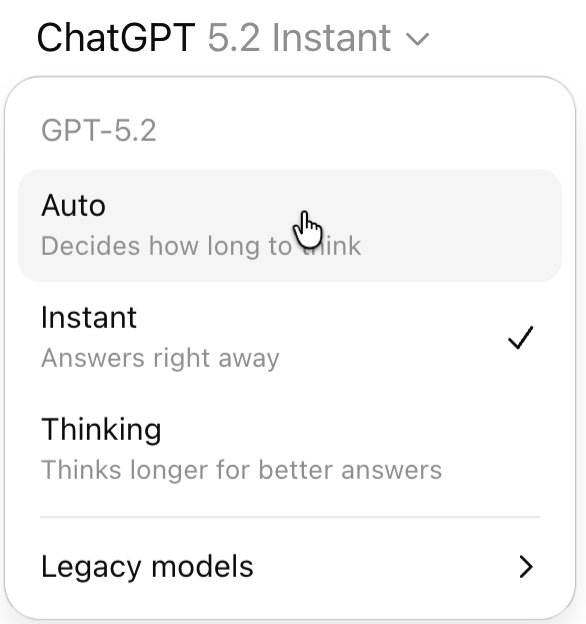
Make sure you select ChatGPT 5.2 auto model for automated analysis.
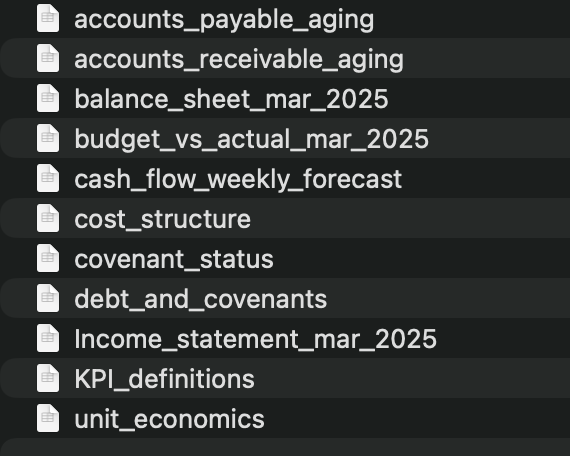
Gather and upload the documents you want to analyze. Do not upload all the documents at once. Identify which documents you wish to analyze using the specific prompt. Here’s the list of documents we have for this tutorial.
Perform forecasting and scenario planning.
Let’s start by doing forecasting and scenario planning. Forecasting predicts a single, probable future using historical data (e.g., next quarter's sales). At the same time, scenario planning explores multiple plausible futures (best, worst, most likely) by combining known facts with uncertainties (social, tech, and economic trends) to build adaptability for long-term strategy, rather than pinpointing one outcome.
Upload the growth percentage, cost structure, and margin targets documents, and use the following prompt.
Prompt:
[upload documents]
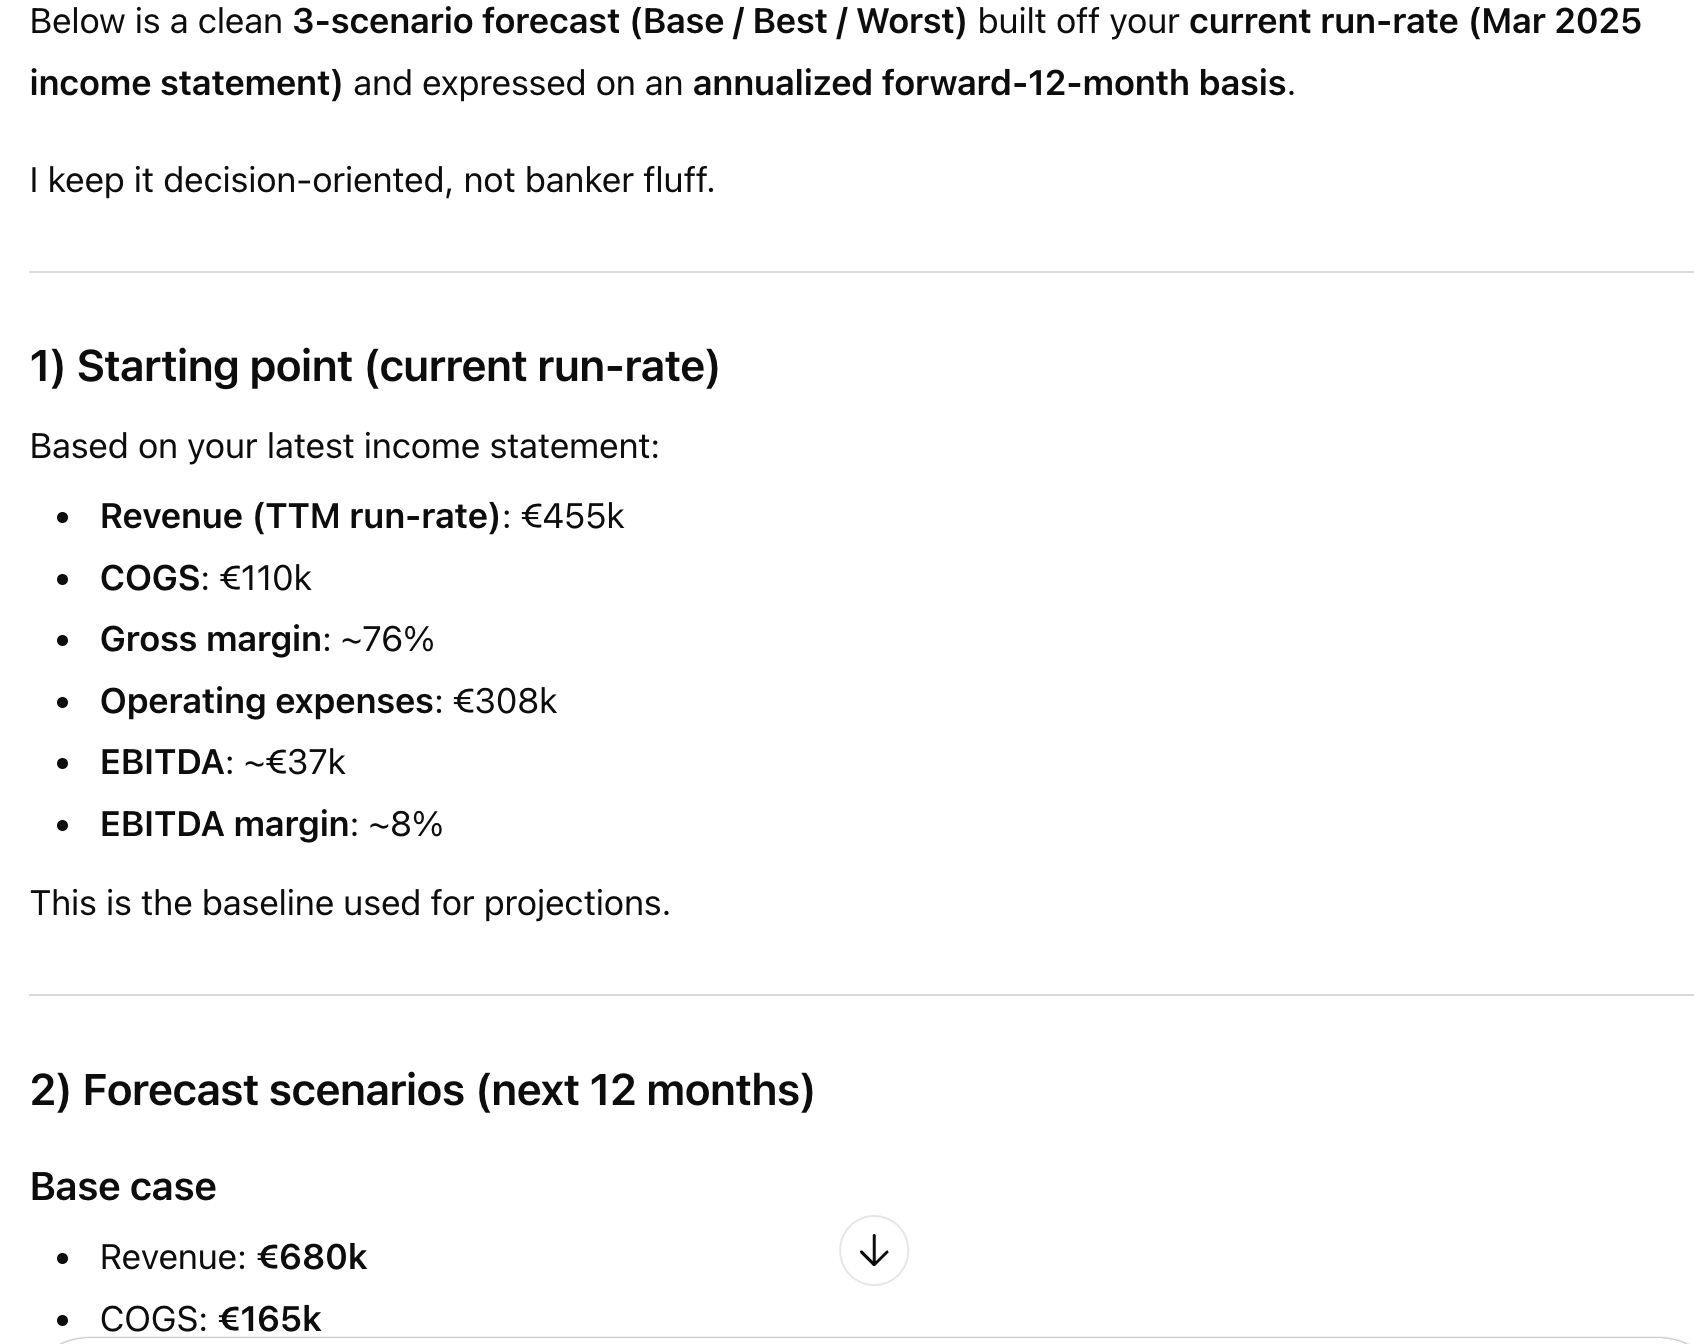
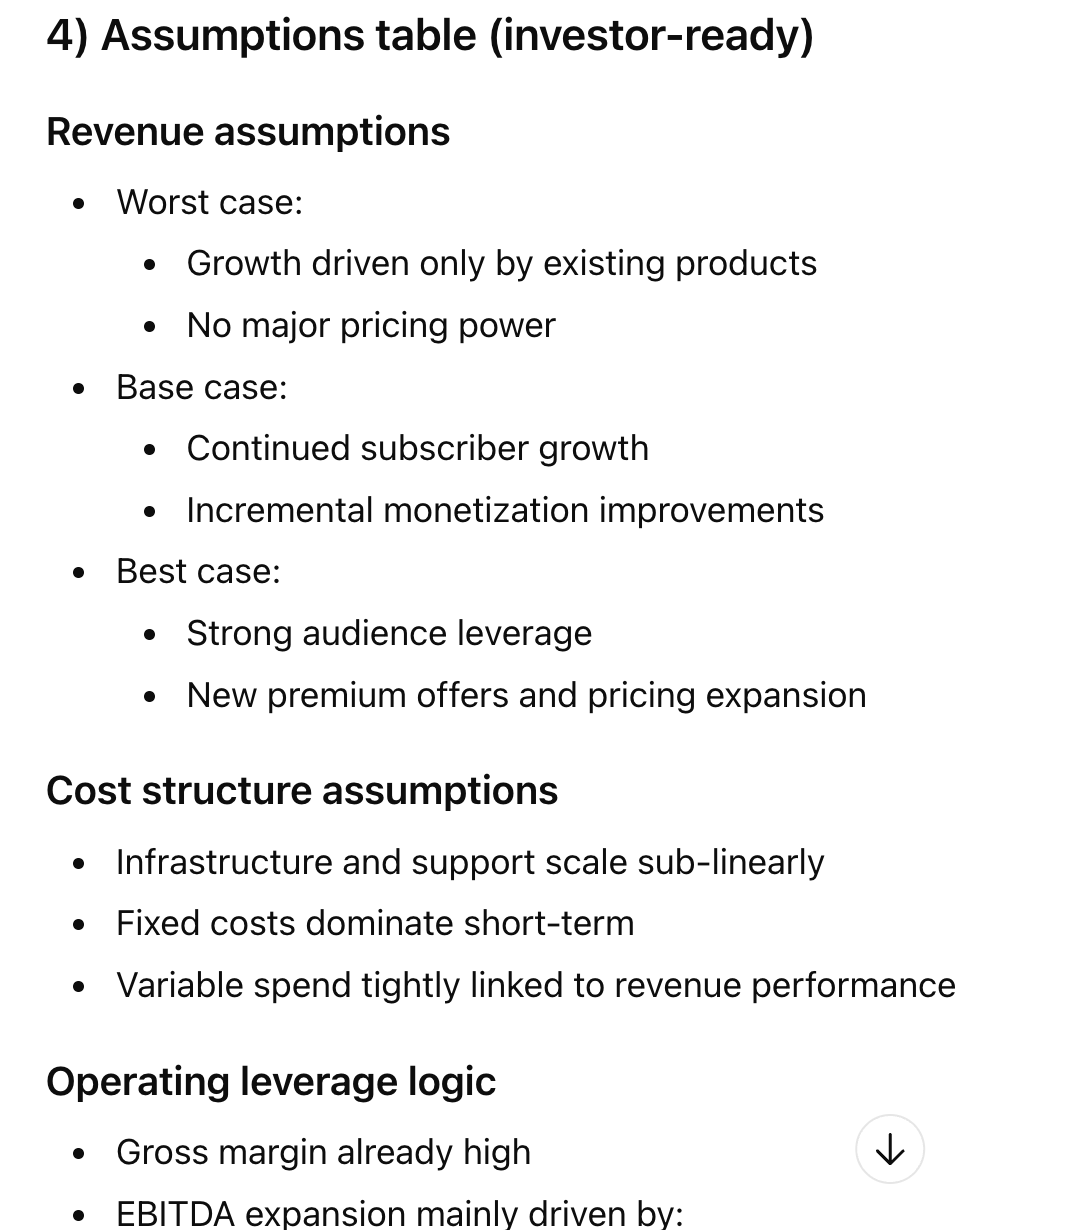
Create a base, best-case, and worst-case forecast for revenue, COGs, and EBITDA. Provide bullet points of the table of assumptions.
Create KPI dashboards
The KPI dashboards are a fantastic tool for quickly viewing financial data and making decisions. Use the following prompt for KPI dashboards.
Prompt:
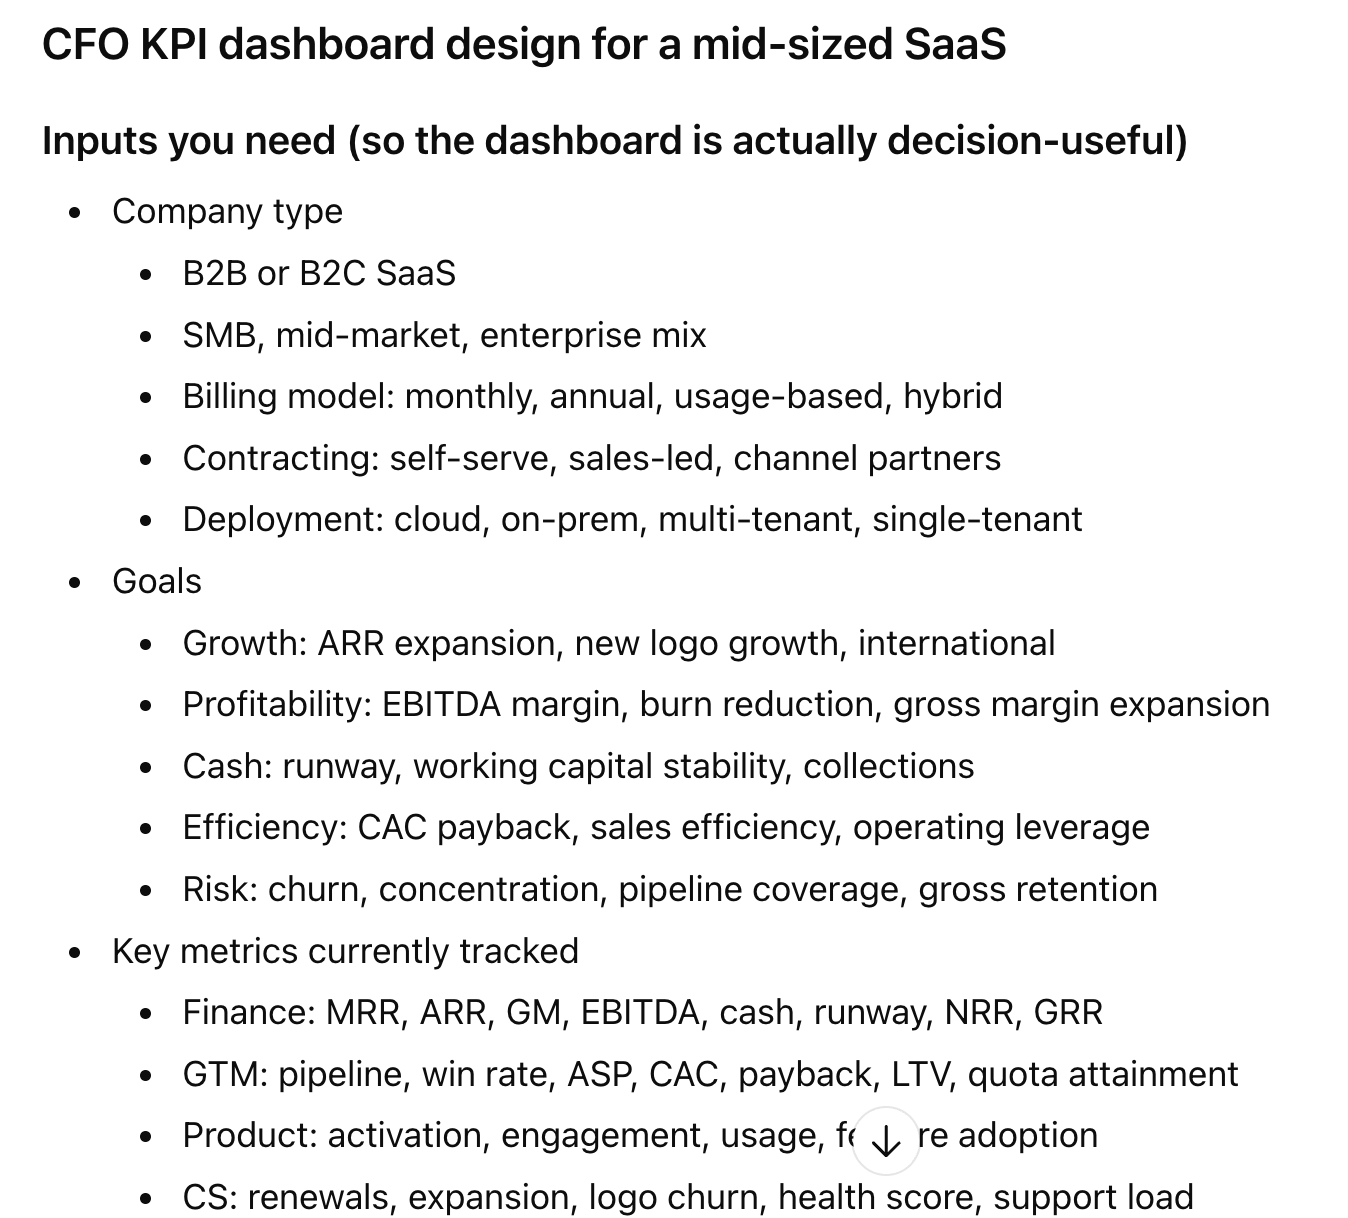
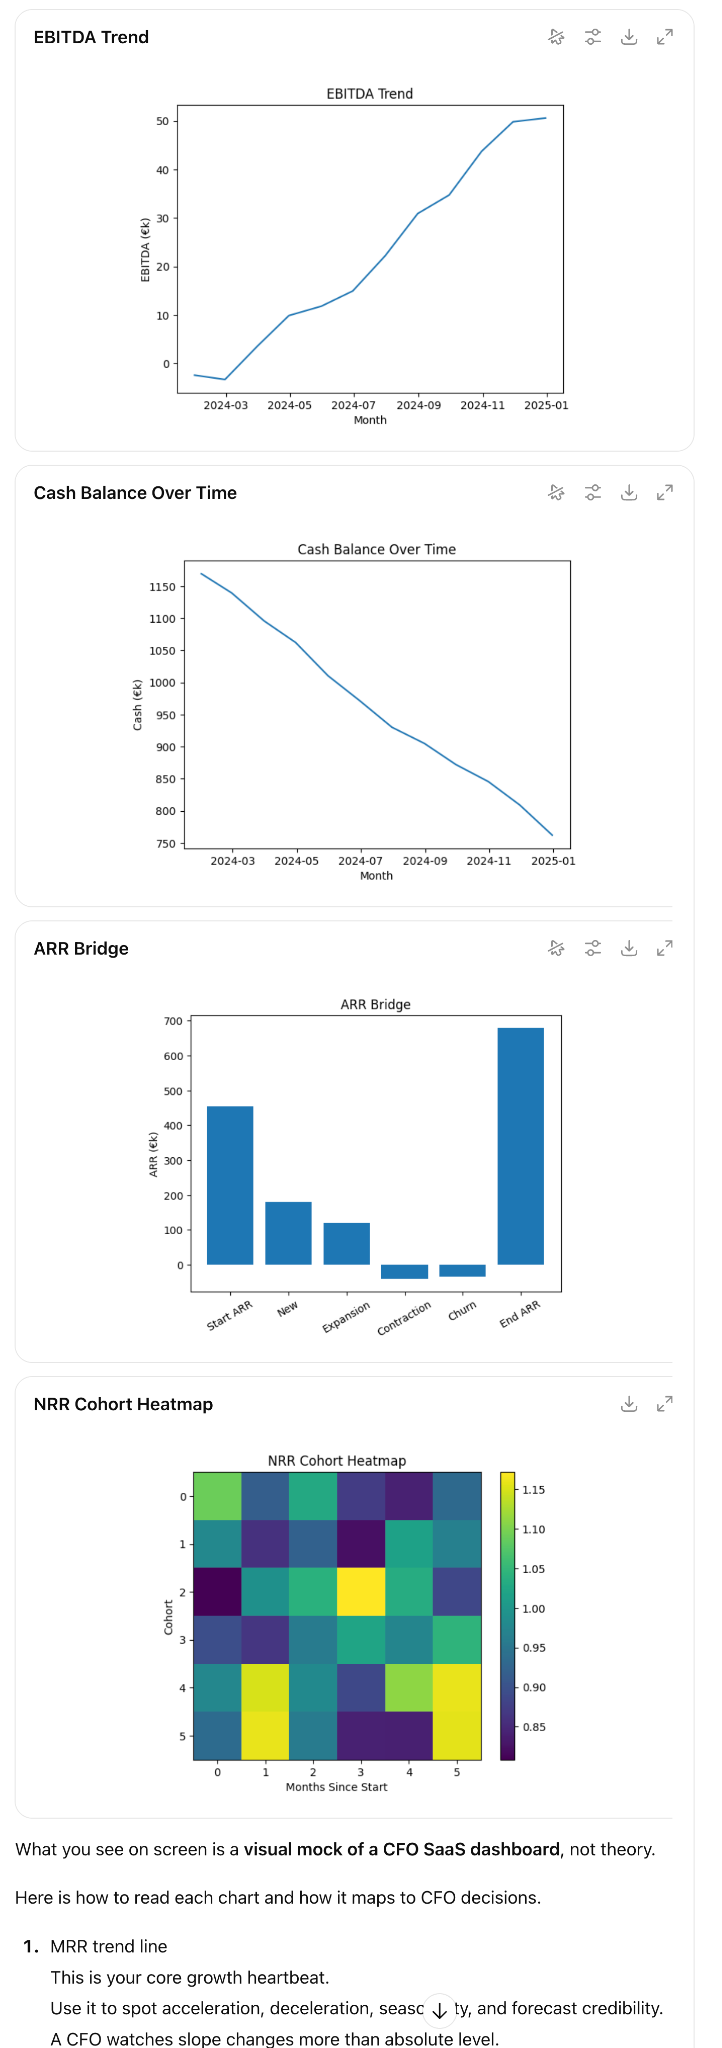
Design a KPI dashboard for a CFO of a mid-sized SaaS business.
Inputs: Company type, goals, key metrics tracked, and departments
Format: bullet list of needs/goals or example KPIs
Outcome: KPI lists + formulas + suggested visuals
Forecast cash flow
Forecasted cash flow is the expected movement of cash in and out of a business over a future period, based on assumptions about revenue, costs, timing of payments, and financing. It shows when the company will actually receive and spend cash, not when revenue or expenses are recognized, and is used to manage liquidity, runway, and funding risk.
Use the following prompt to generate a forecasted cash flow.
Prompt:
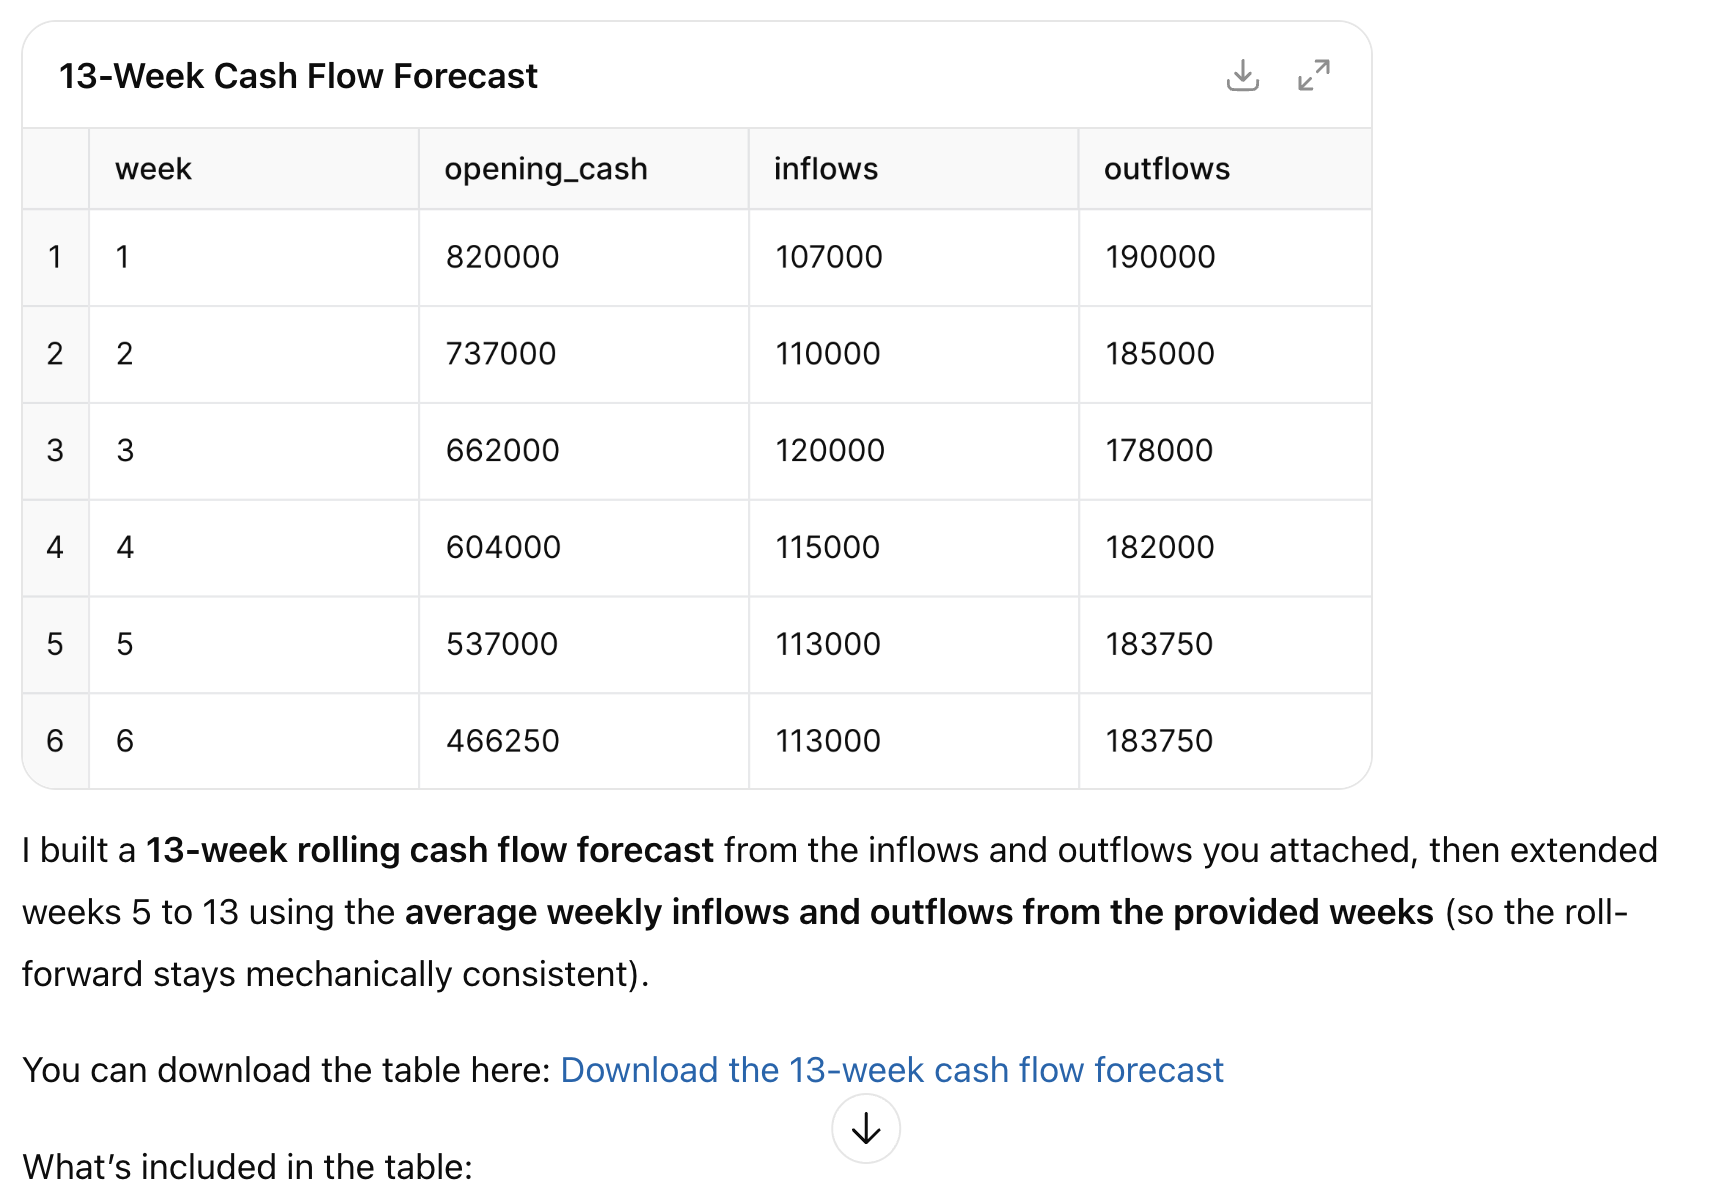
Create a thirteen-week cash flow forecast based on these inflows/outflows. [Attach cash inflows and outflows documents]
Input: Weekly inflows (collections) and outflows (payroll, rent, etc.)
Format: table with weekly amounts
Outcome: rolling forecast + net cash position by week
Optimize working capital
Optimizing working capital means managing cash, receivables, payables, and short-term liabilities so the business has enough liquidity to operate and grow, without tying up unnecessary cash.
To optimize working capital, use the following prompt.
Prompt:
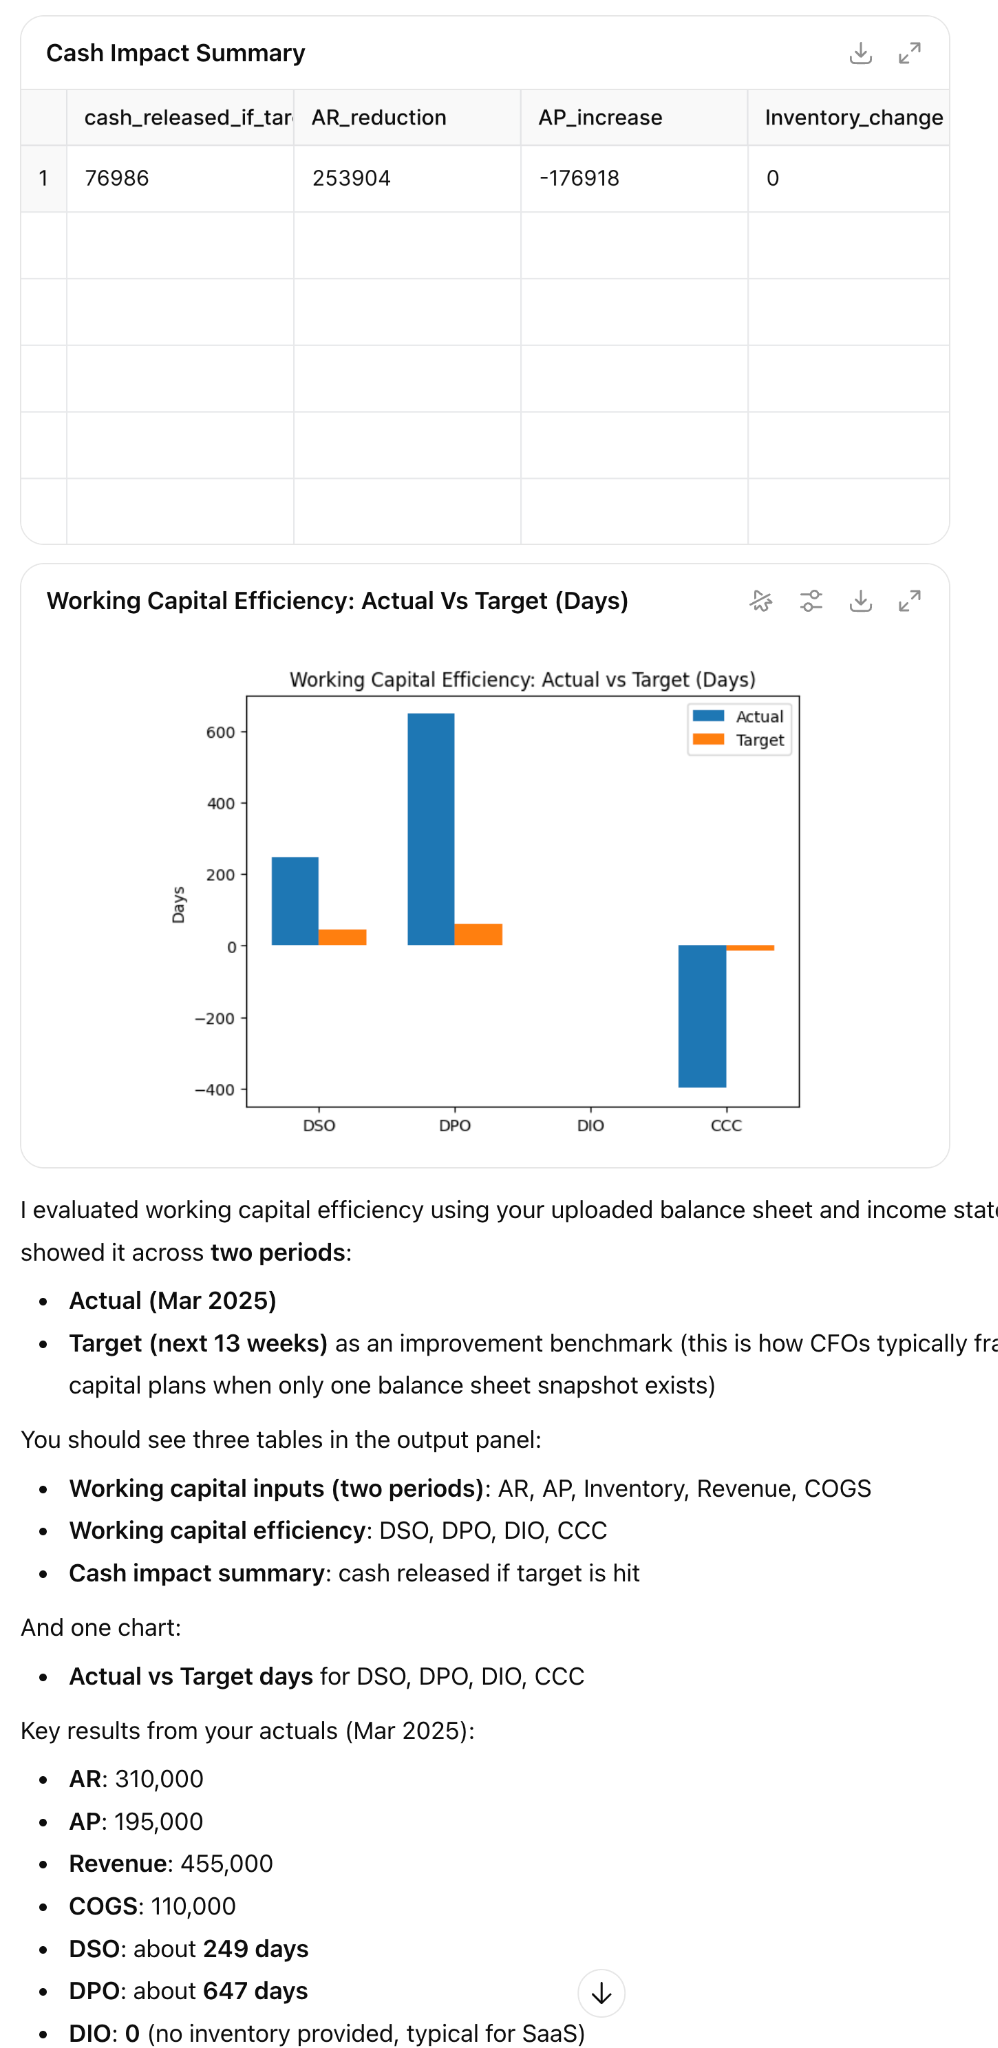
Evaluate working capital efficiency using these financials [attach budgeting documents]
Input: AR, AP, Inventory, COGs, Revenue
Output: Tables with values for at least two periods
Outcome: DSO, DPO, DIO, CCC analysis + improvement ideas
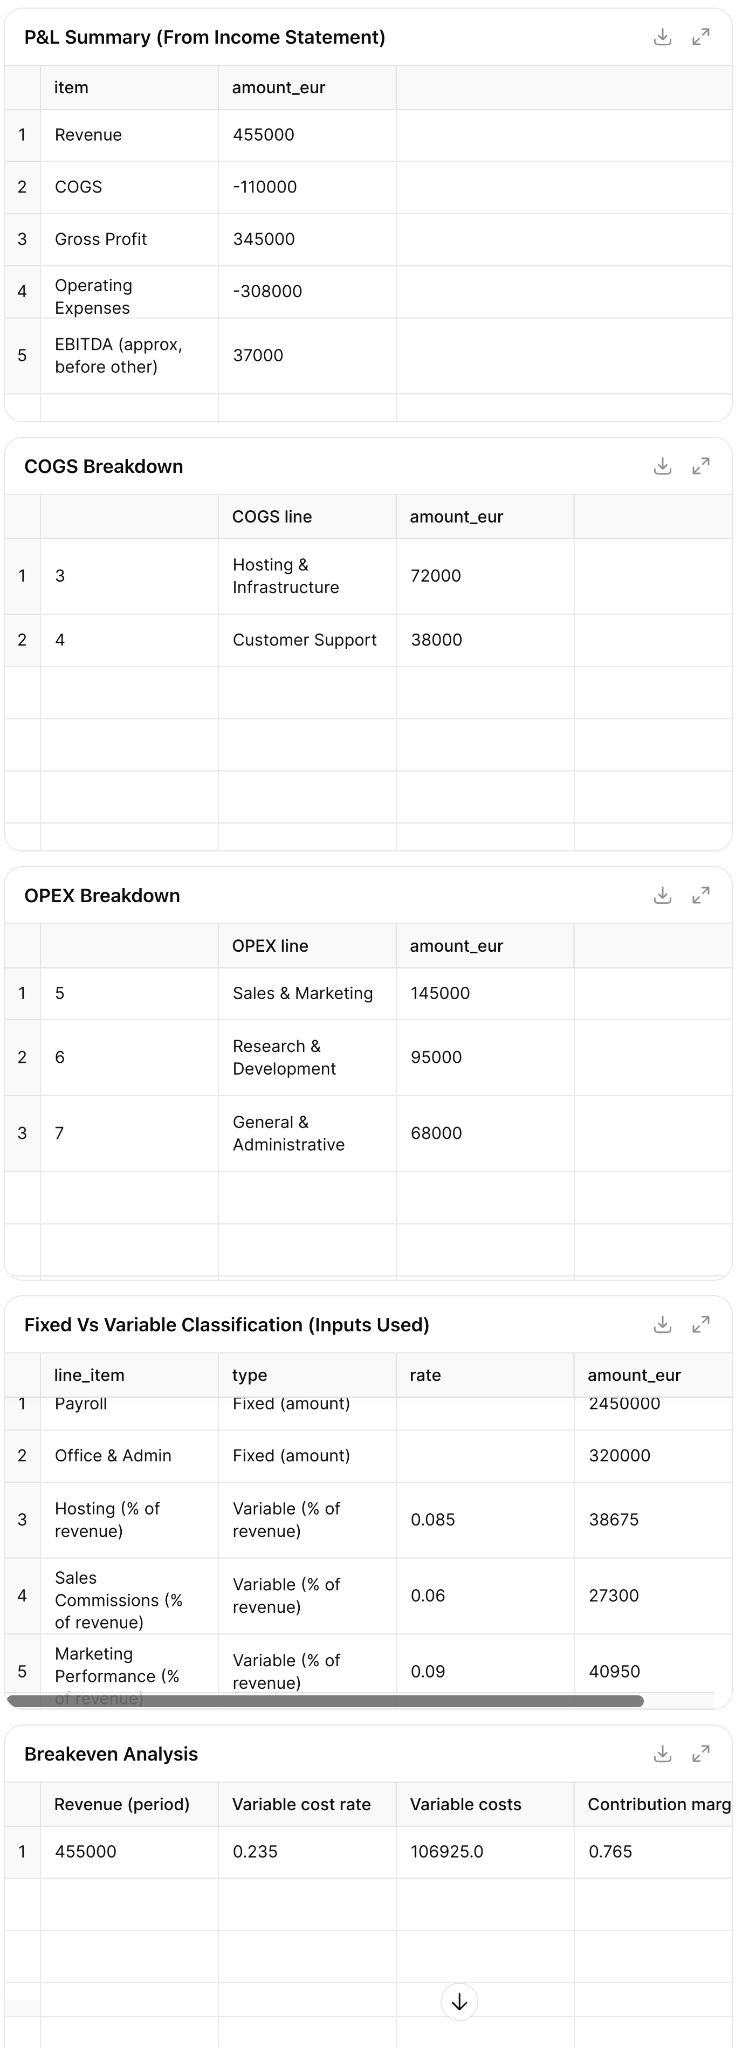
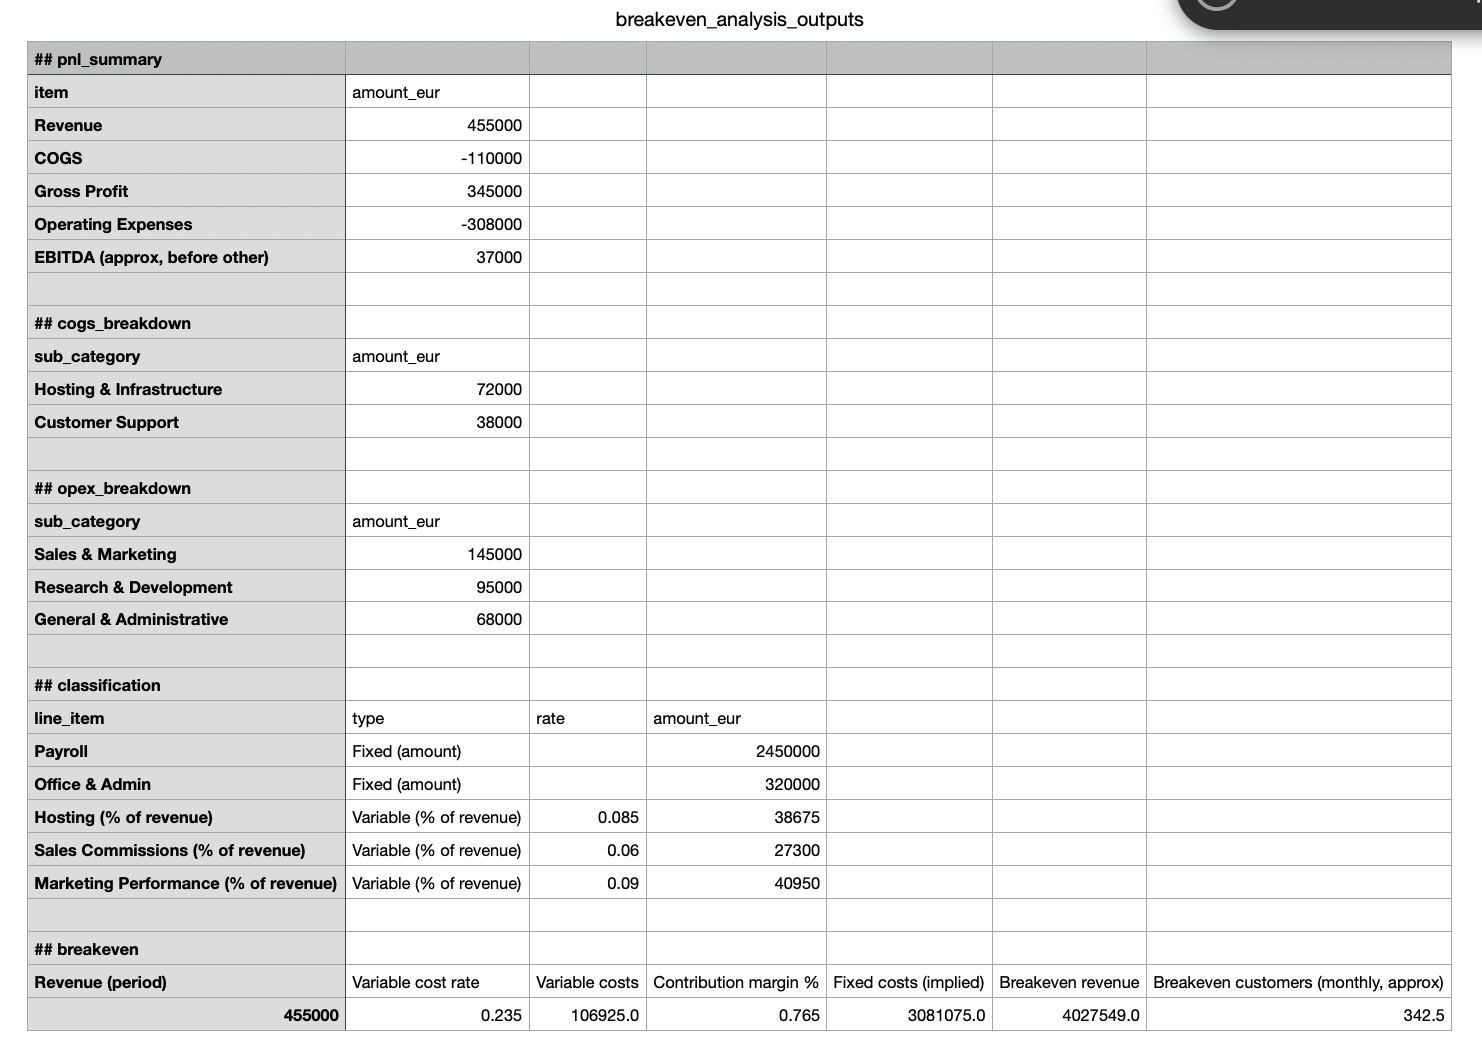
Analyze cost structures
Cost structure analysis is the process of breaking down a business's expenses into fixed (rent, salaries) and variable (materials, direct labour) components to understand cost drivers, optimize spending, set prices, and improve overall financial health and profitability.
To analyze cost structures, use the following prompt.
Prompt:
Categorize the company’s costs into fixed and variable, and calculate the breakeven point.
Output: P&L data (Revenue, COGs, OPEX breakdown)
Input: Table or pasted values by line item
Outcome: Cost classification + breakeven analysis
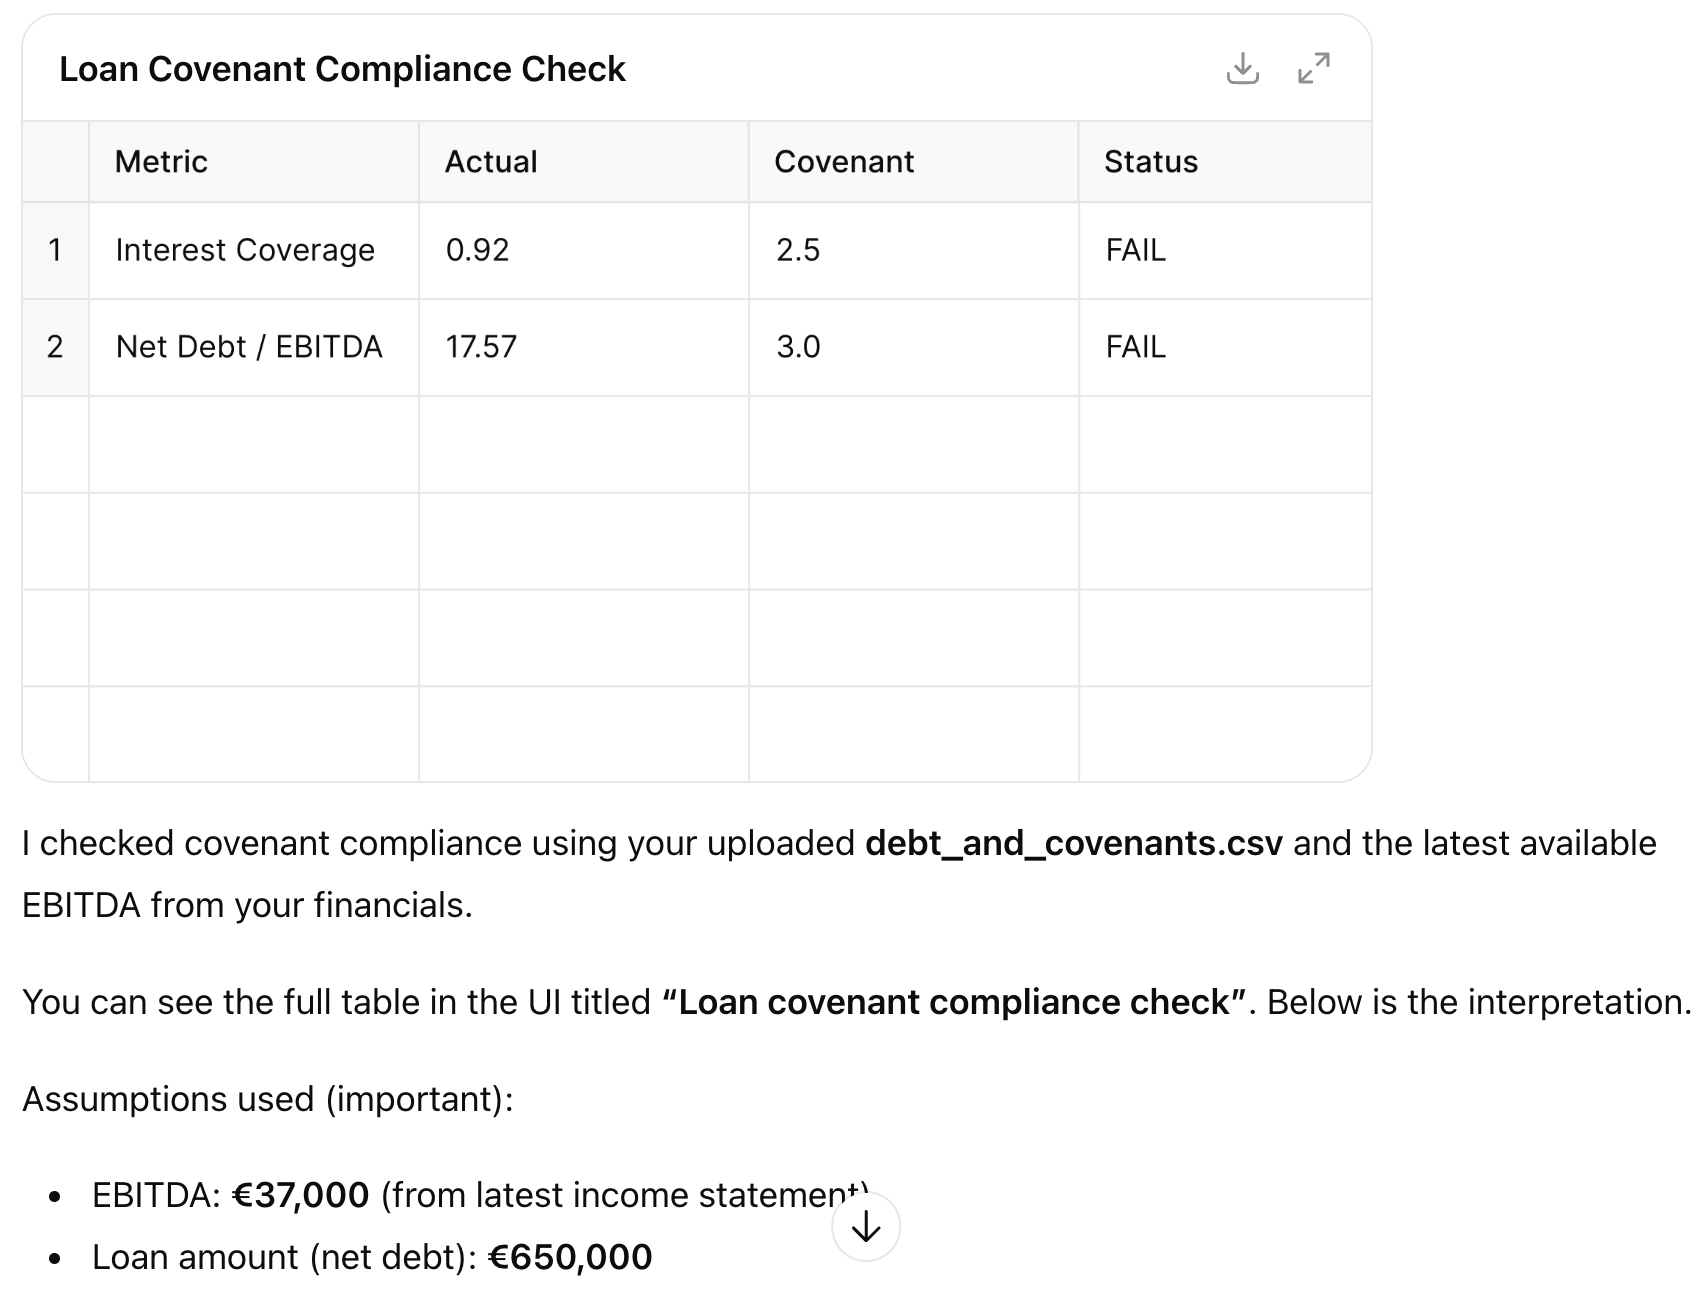
Monitor covenants
Monitor covenants are clauses in loan agreements that basically say, "keep us in the loop." They require borrowers to regularly share financial information, such as statements, reports, or key metrics, with lenders. Unlike other covenants that can trigger default if you miss a target, these are more about transparency. They give lenders a heads up on how you're doing financially so they can spot trouble early and step in if needed.
To monitor covenants, use the following prompt.
Prompt:
Check if these financials meet the loan covenants.
Input: EBITDA, interest, net debt, covenant thresholds
Output: Table or simple list of metrics
Outcome: Compliance status + explanation
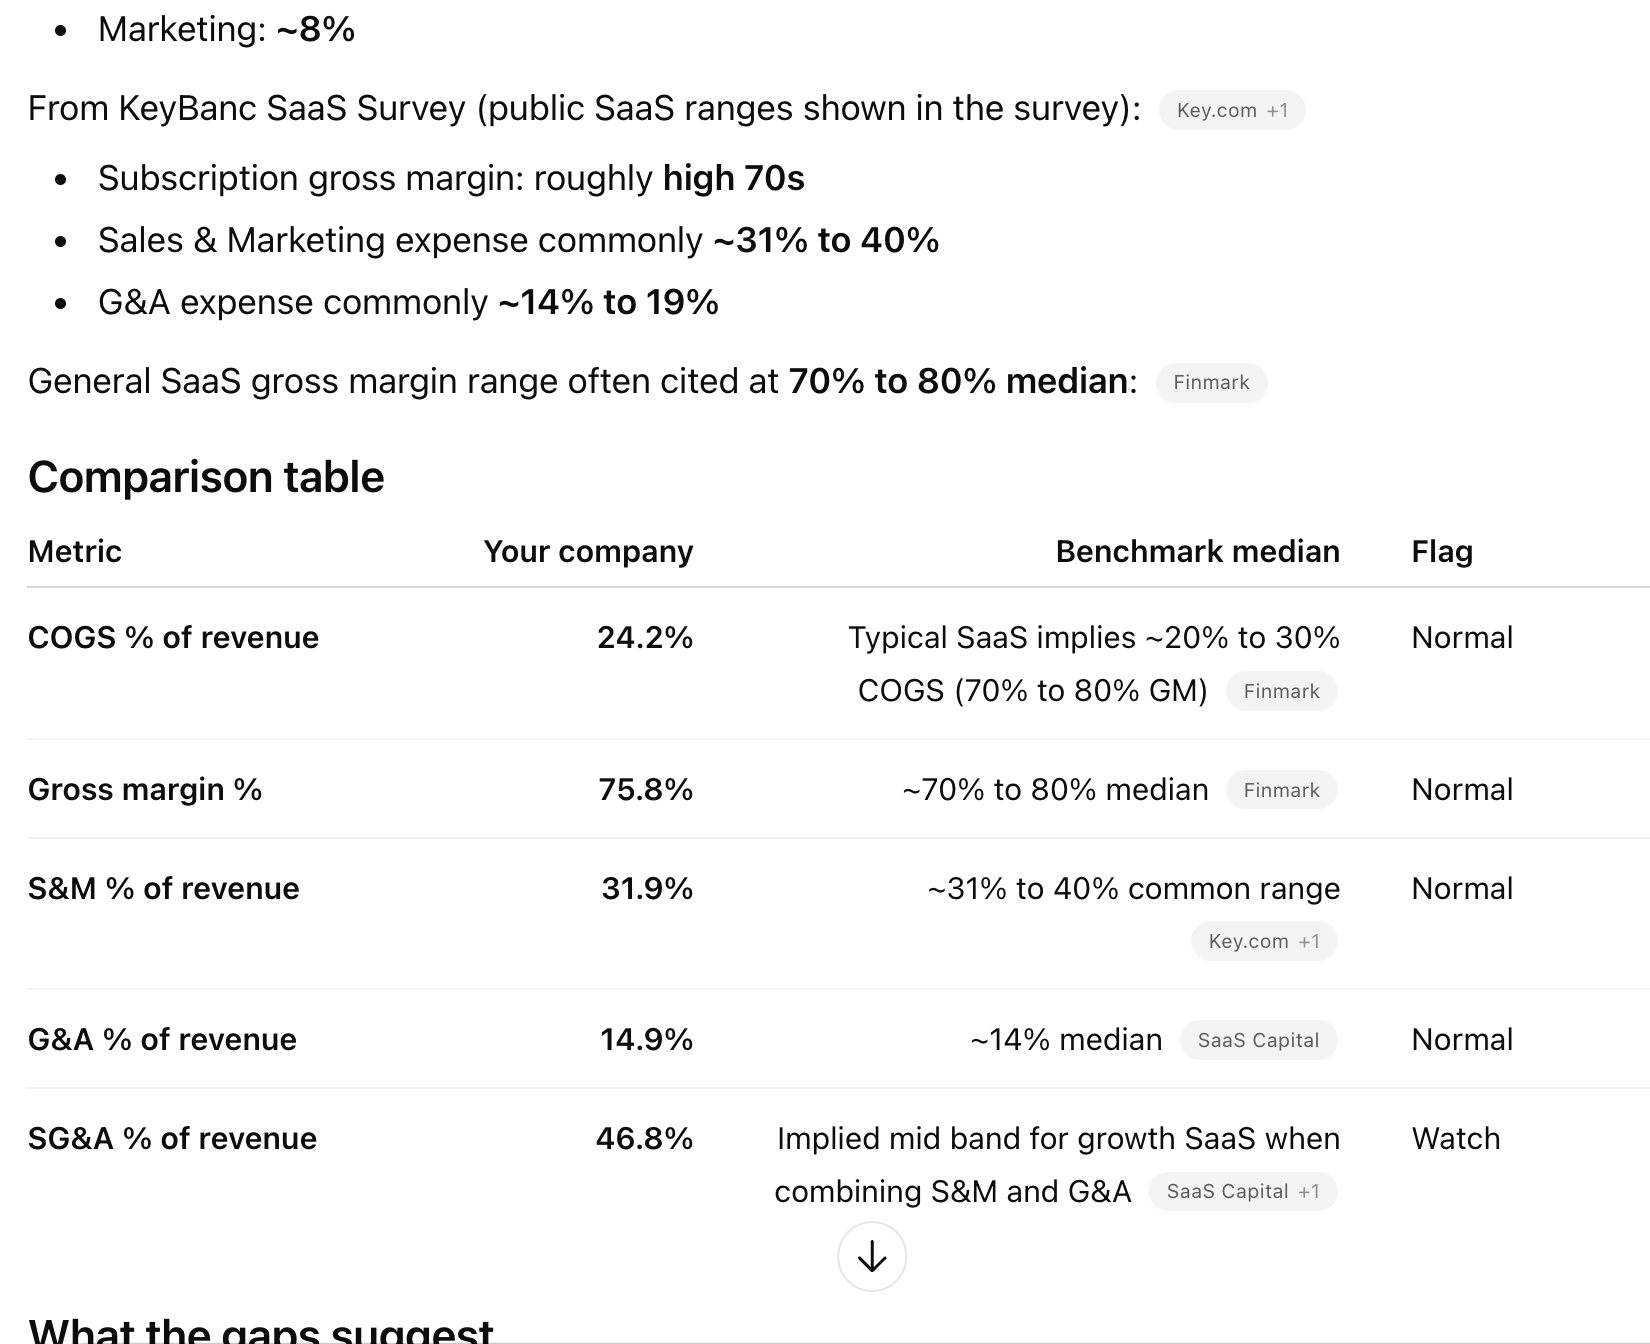
Benchmark operational efficiency
Benchmark operational efficiency is basically comparing how well your company runs its day-to-day operations against industry standards or competitors. You look at metrics like cost per unit, revenue per employee, or production time and stack them up against the best performers in your space. The goal is to spot where you're lagging, find areas to cut waste, and set realistic targets for improvement based on what top players are actually achieving.
To benchmark operational efficiency, use the following prompt.
Prompt:
Compare my company’s SG&A and COGs to industry benchmarks
Input: Company metrics + industry/sector
Output: Table of financials or ratios
Outcome: Benchmark gaps, performance flags, improvement areas
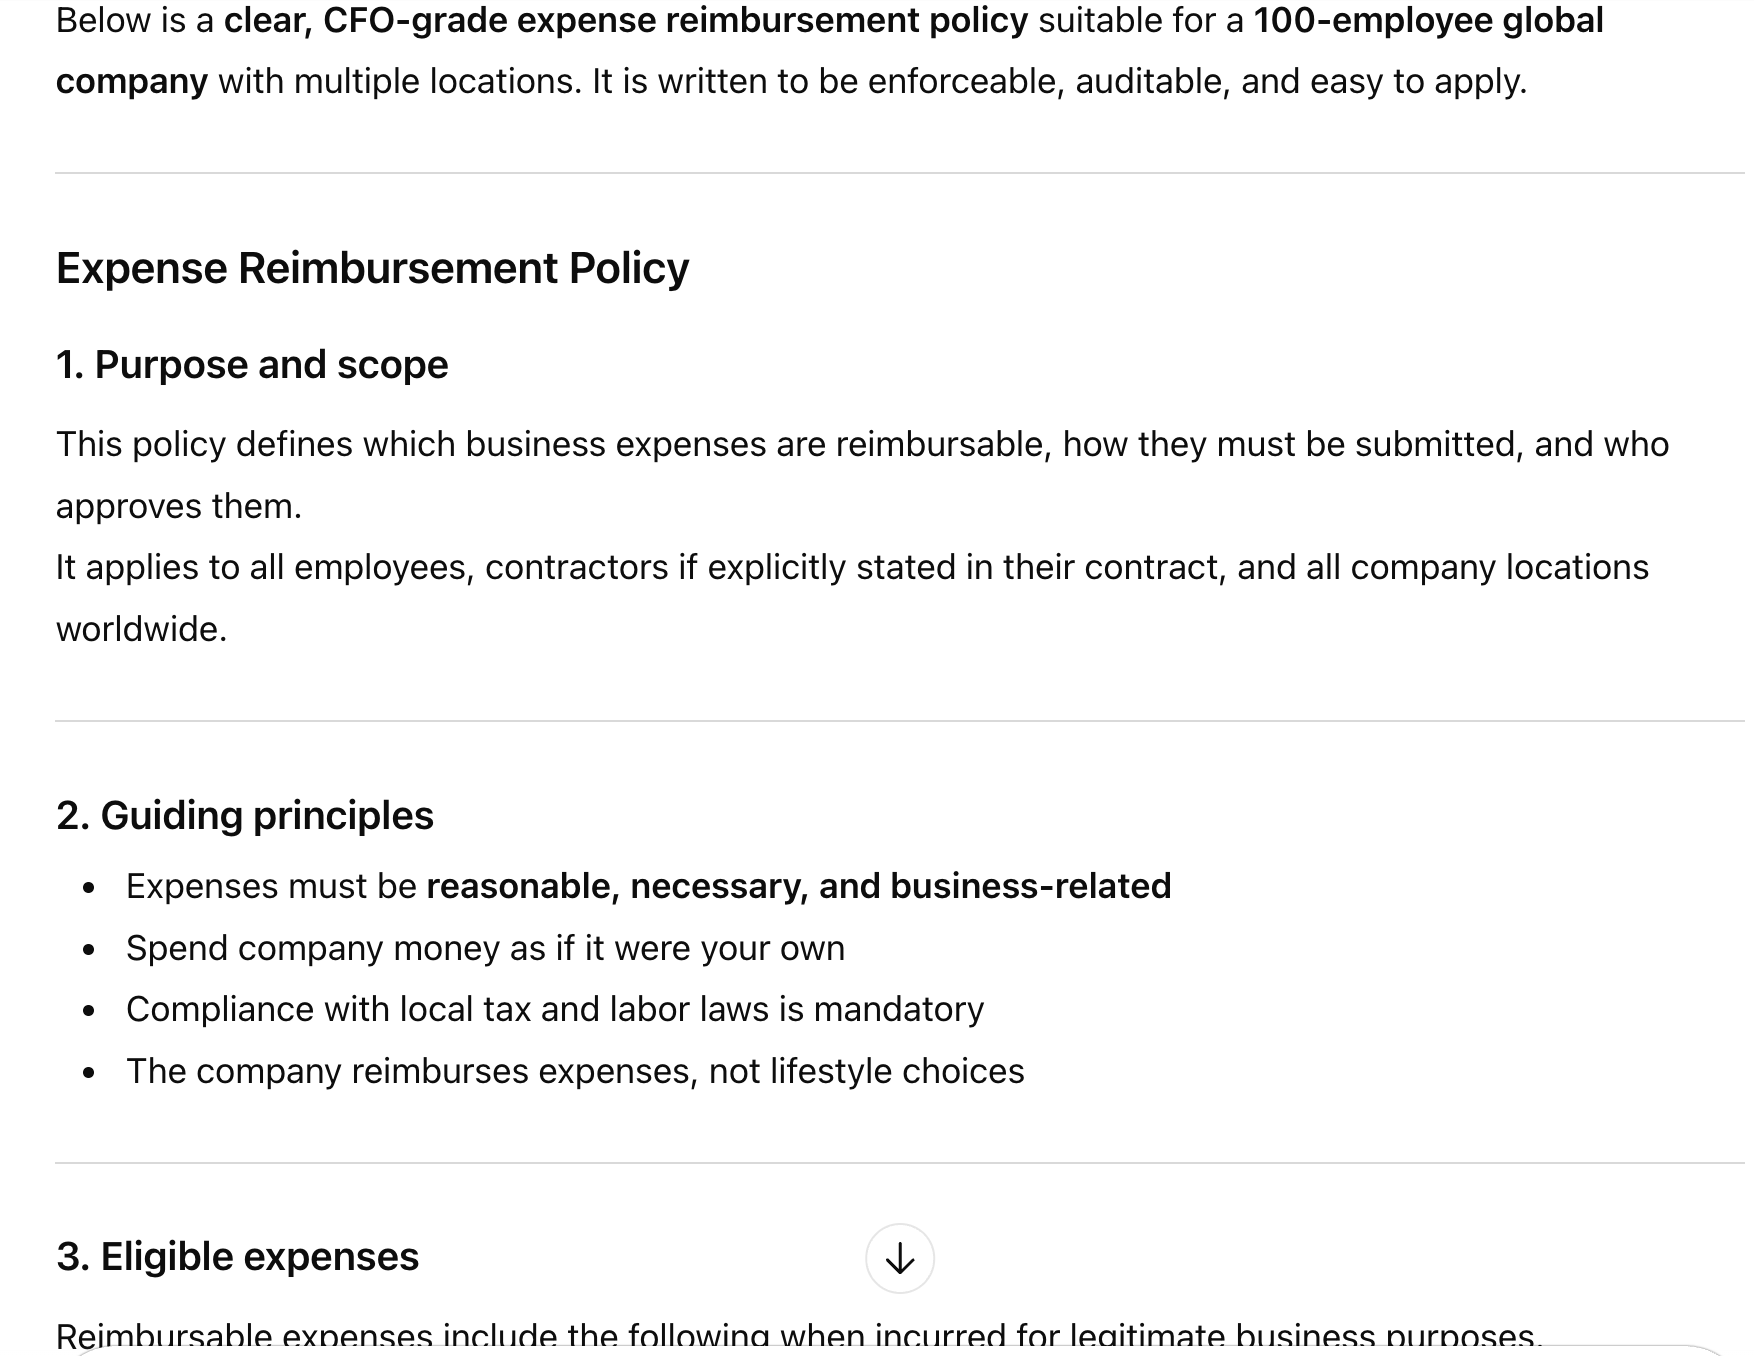
Create a finance policy draft.
A finance policy draft is basically a working document that outlines the rules and guidelines for how an organization handles its money. It covers topics such as spending limits, approval processes, expense reimbursements, budget management, and financial controls. It's called a draft because it's not finalized yet and still needs review, revisions, and sign-off from leadership before becoming official policy. Think of it as the rough version that gets passed around for feedback before everyone agrees on the final rules.
Prompt:
Write an expense reimbursement policy for a 100-employee global company.
Input: Company size, scope, locations, approval levels
Output: Bullet list of parameters
Outcome: Full policy with sections, rules, and examples
That’s it for this tutorial, finance buffs! You now have a complete, practical prompt set that mirrors how real finance teams think and operate. Each prompt is designed to move from raw data to decisions, not just analysis, and to force clarity on assumptions, risks, and trade-offs. Used together, they let you pressure-test performance, liquidity, and profitability with the same rigor a CFO, lender, or investor would expect. The real value is not the outputs themselves, but the repeatable reasoning process you can reuse as the business evolves.
.avif)

.avif)