.avif)
Everything’s getting automated, so why are we still winging our budgets and grocery lists? Prices feel like they refresh every time you blink, and the only thing going down is your bank balance. If you’re still on a pre-COVID paycheck, keeping up with kitchen staples can feel like bidding at an auction you never meant to attend. The only fix that comes to mind in the AI era is to put budgeting and grocery planning on autopilot. Think smart lists that swap in sale items, meal plans that reuse ingredients, price alerts before you shop, and a weekly spending cap that taps you on the shoulder before the cart mutinies. Let the robots do the math while you keep the snacks, so dinner stays tasty, bills stay boring, and avocados stop feeling like luxury purchases.
Julius AI has come up with something many of us can appreciate - A budgeting and grocery planning automation that saves your quickly deprecating bank account. In this tutorial, we’ll guide you on how to access Julius AI, describe your dataset (don’t worry, it is not as difficult as it sounds), submit your analysis request, and visualize and act on the insights.
By the end of this tutorial, you’ll be able to:
- Access Julius AI
- Describe your dataset
- Submit your analysis request
- Visualize and act on the insights
Let’s get on with it!
Step 1 - Access Julius AI
Julius is like any other AI service, but with a twist. It gives you the ability to connect to various data stores like Google Drive, Microsoft OneDrive, Notion, SharePoint, Stripe, and many others. You can pull data from these services and use Julius to sanitize, analyze, and get insights into those endless columns of data.
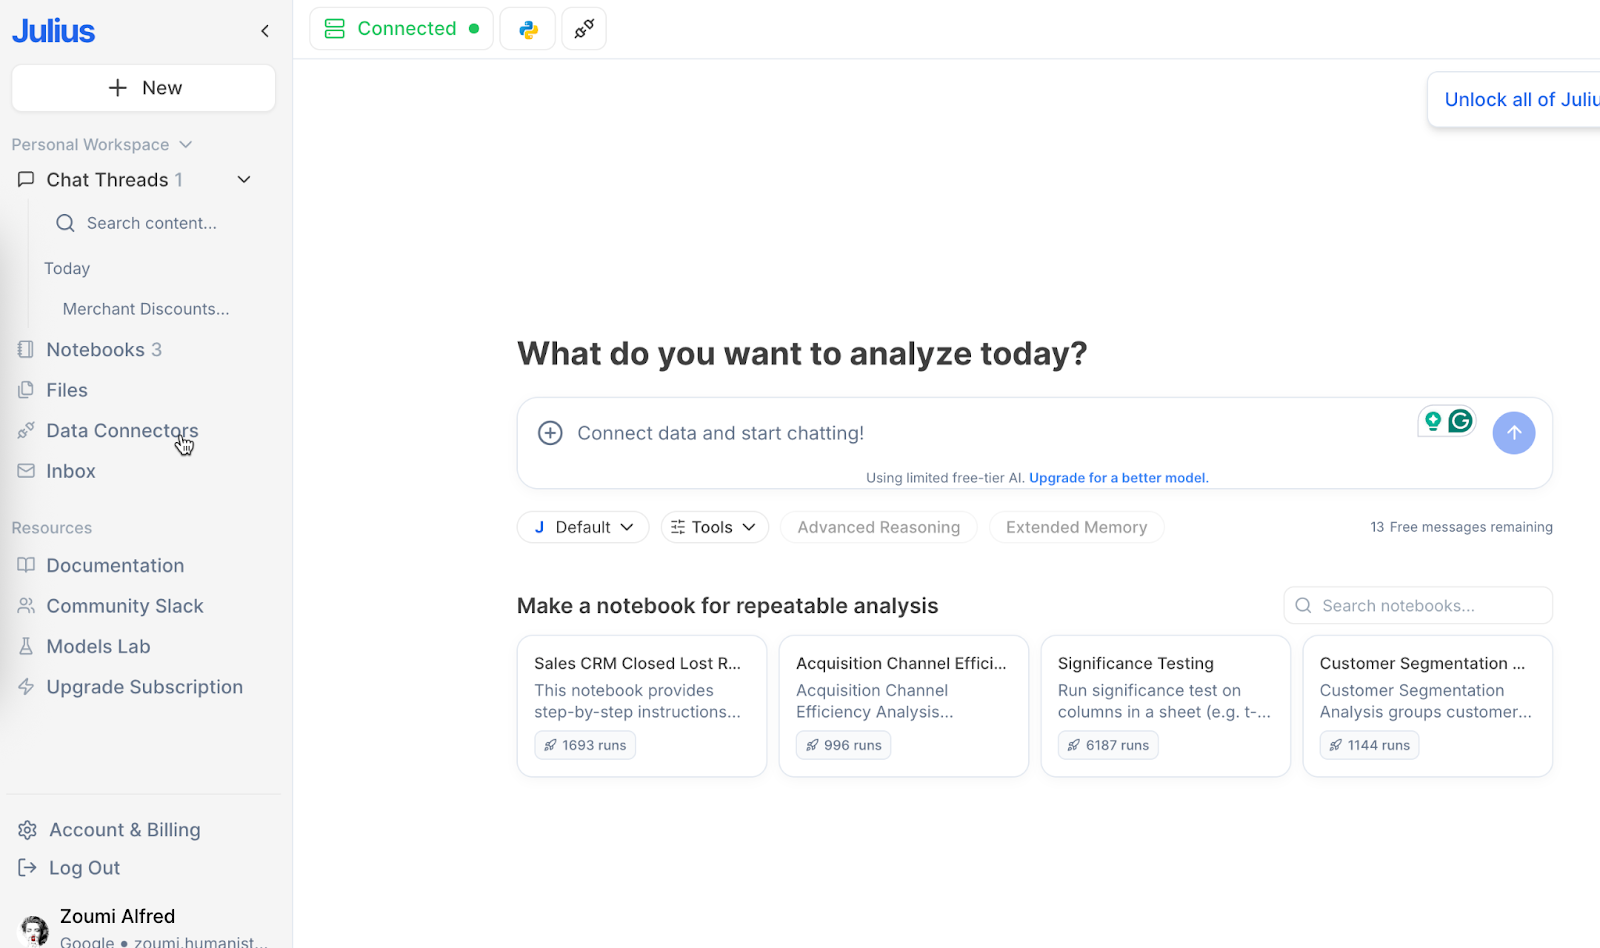
Access Julius AI and log in to an account or create a new one.

Before embarking on a prompting spree, we urge you to check one of the most prominent features of Julius AI - The Data connectors! Data connectors allow you to connect to a datastore. You can import the data from those data stores and use Julius to analyze the data.
There are many options you can choose to import data from. Take a look!
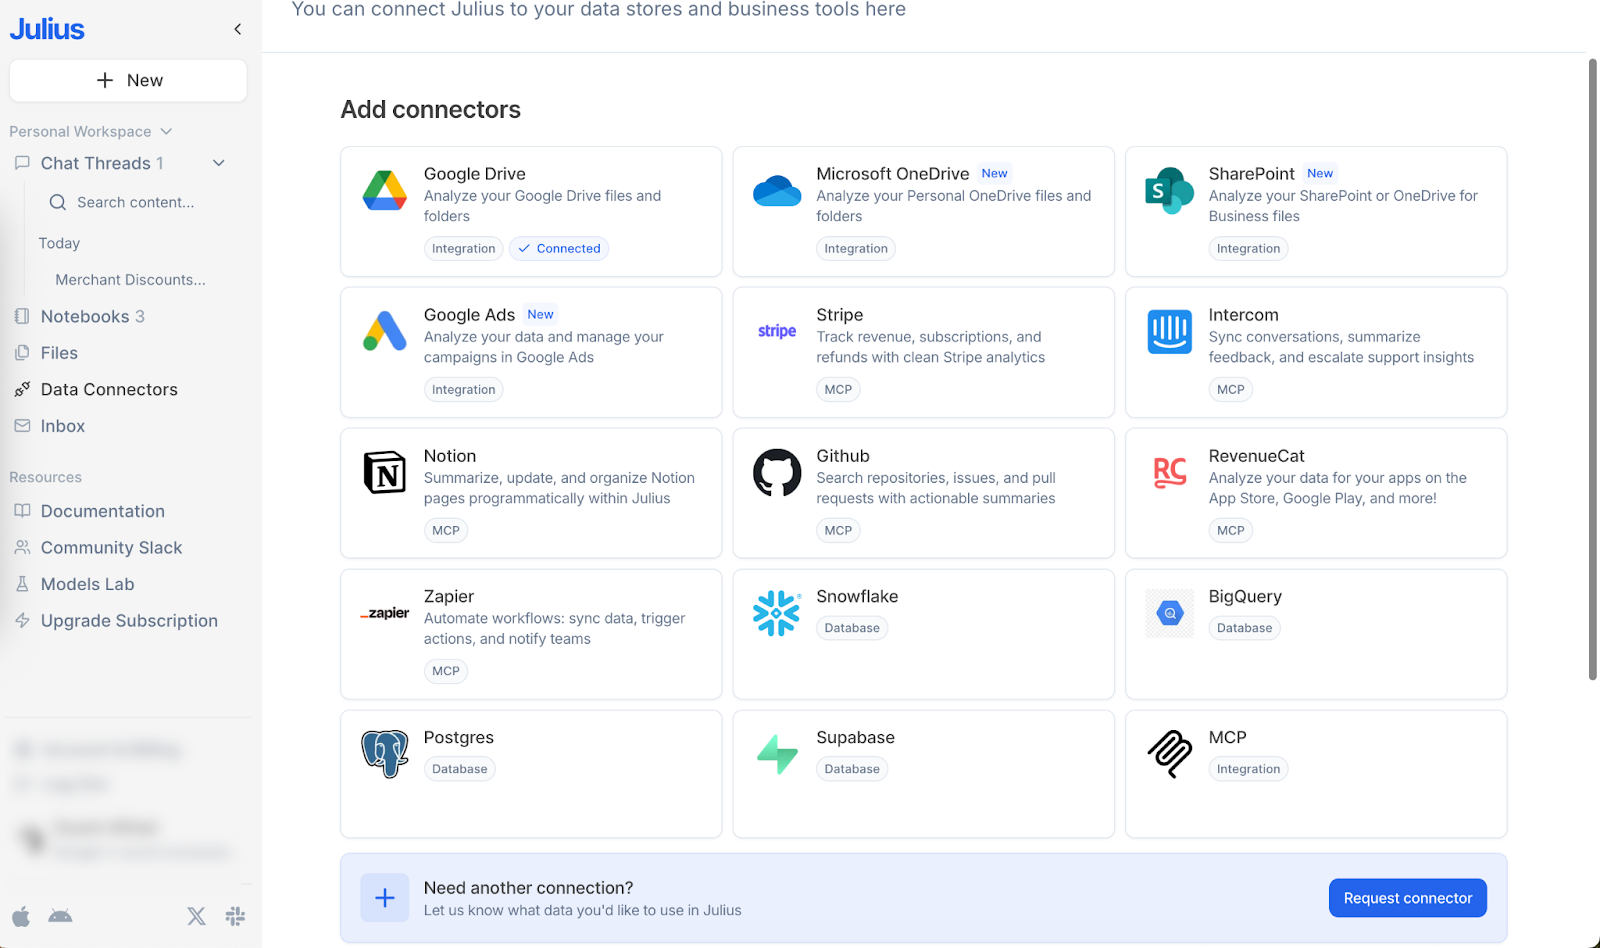
Head over to “Add Data Connectors.” From there, you’ll find options to link Julius with tools like Google Drive, OneDrive, SharePoint, Notion, and plenty of others. Since your files are usually scattered across different platforms, these connectors make it easy to pull everything together seamlessly.
Step 2 - Describe your dataset
Let’s upload the grocery list. Most people use Excel or Numbers (Mac) to list groceries, budget, or both offline. Not many of them upload files to Google Drive or another cloud storage service. So we will use an offline Excel file to get started.
Click the ‘+’ button and upload your grocery file. Julius will load the data. It will sanitize it automatically.
Not only will it upload the data, but it will also show clarification on what it did with it while it was being uploaded.
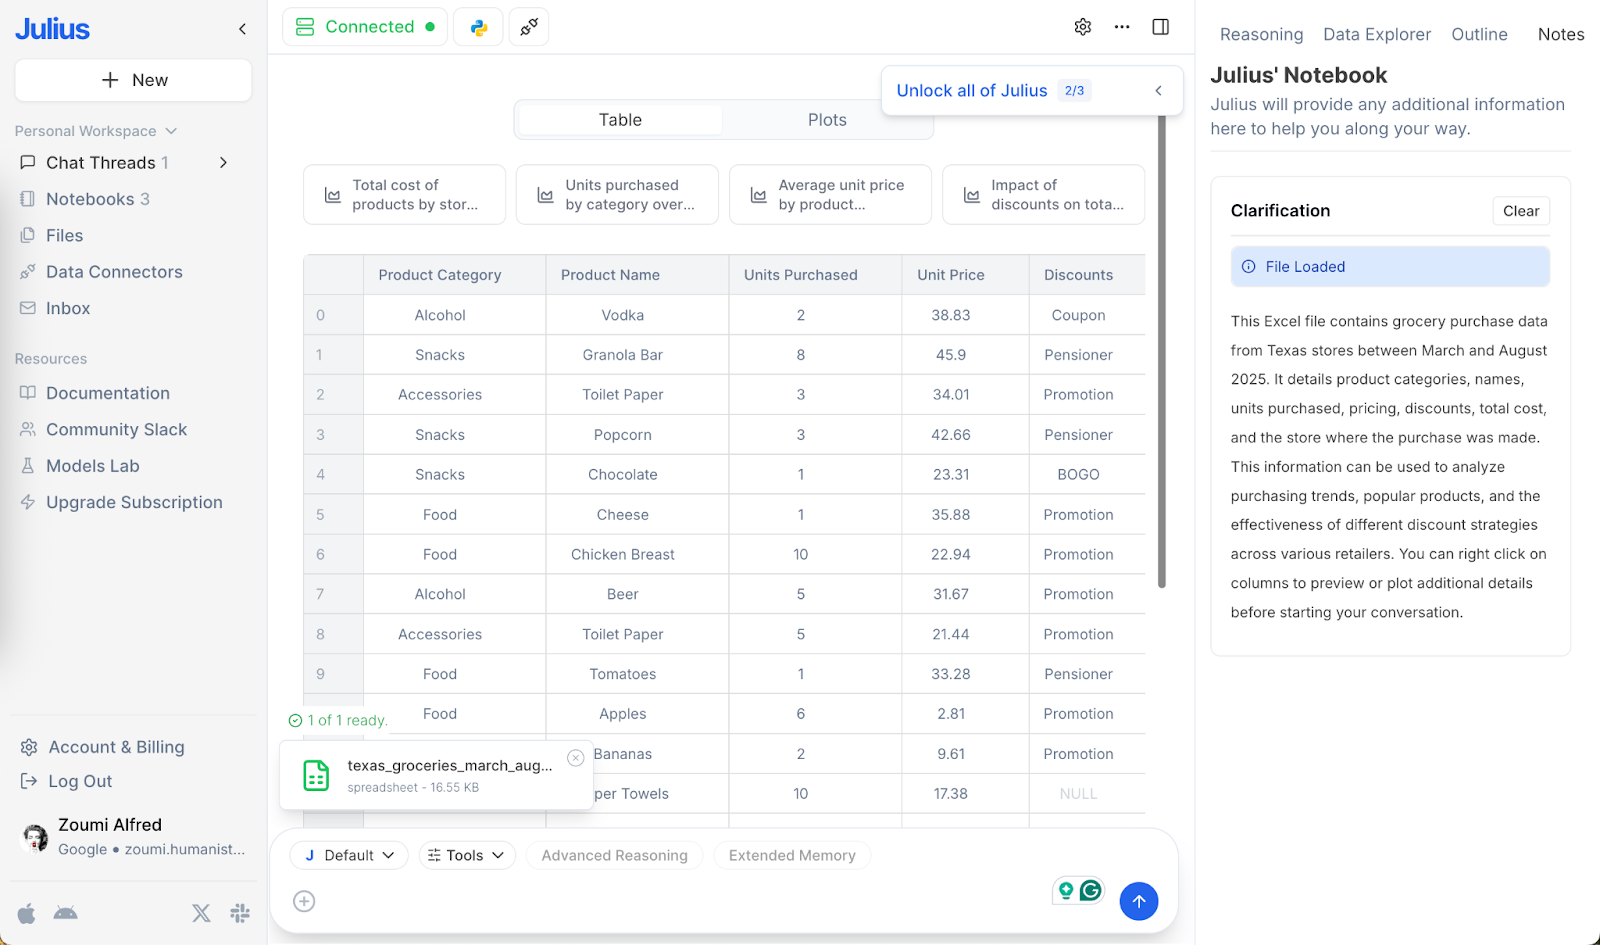
The file includes the following fields:
- Product Category (e.g., Food, Alcohol, Accessories)
- Product Name
- Units Purchased
- Unit Price
- Discounts (e.g., Pensioner, Promotion)
- Total Cost
- Store Name
- Purchase Month
Now you can get insights into your grocery list and see where your monthly budget is going.
Step 3 - Submit your analysis request
You can now go on a prompting spree. So basically, you need to find out about the expenses and where you are spending more. This information can help you streamline your spending habits.
Prompt:
Identify the items that consume the most money overall (highest total cost across all months).
Highlight which items are purchased most frequently/repeatedly across the dataset.
Present the results clearly, ranking the top 5 in each category.
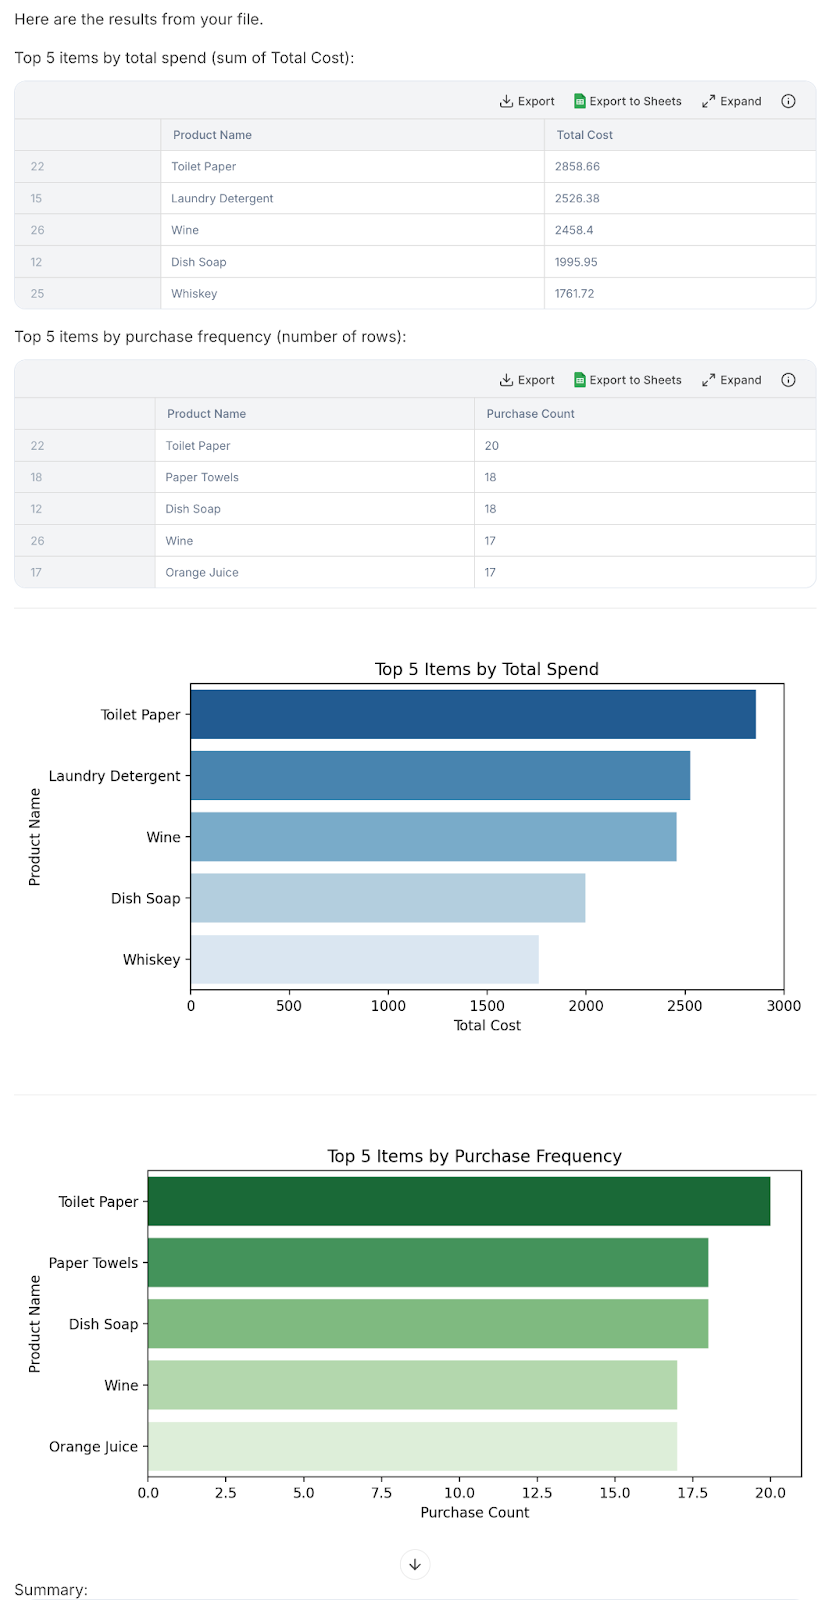
That’s wonderful. Julius showed where the money was going and created a graphical representation of the data for quick consumption.
Let’s see if it can identify the items that make up most of our spending!
Prompt:
Which categories make up most of my spending?
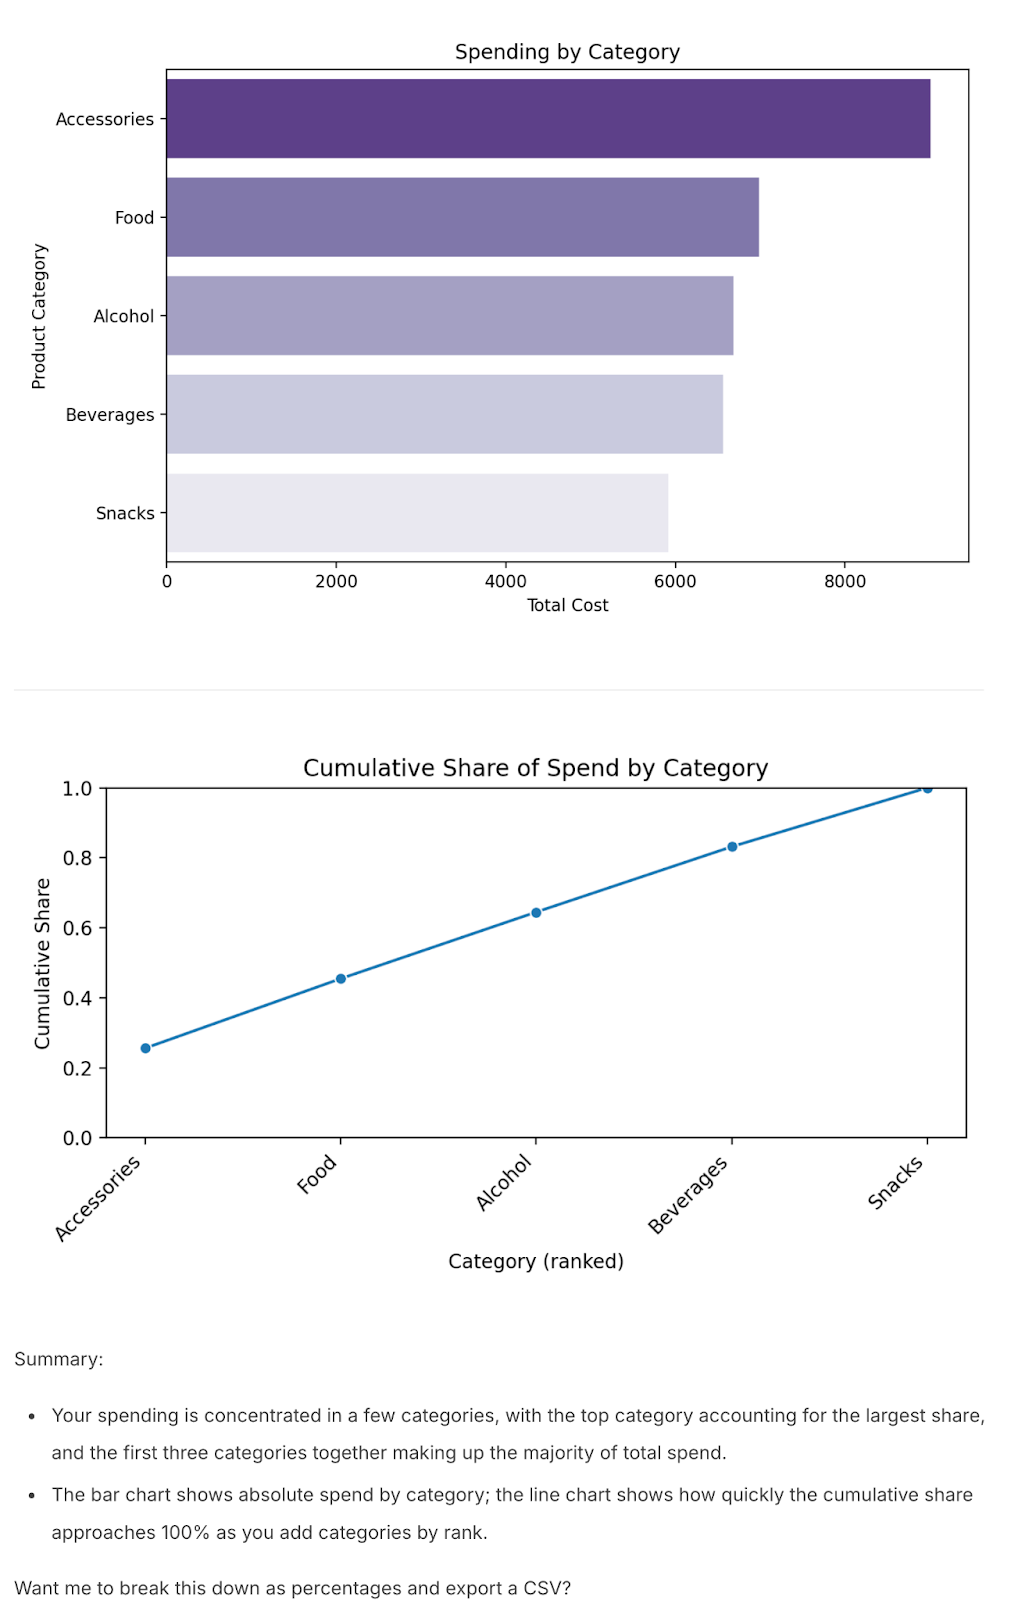
Once your data’s processed, getting insights is as easy as chatting. Just type your questions in plain language, and the system will give you the answers.
Another way to find important insights in your grocery list data is to find out which stores do we visit frequently to do our grocery shopping.
Prompt:
Which store do I spend the most money at?
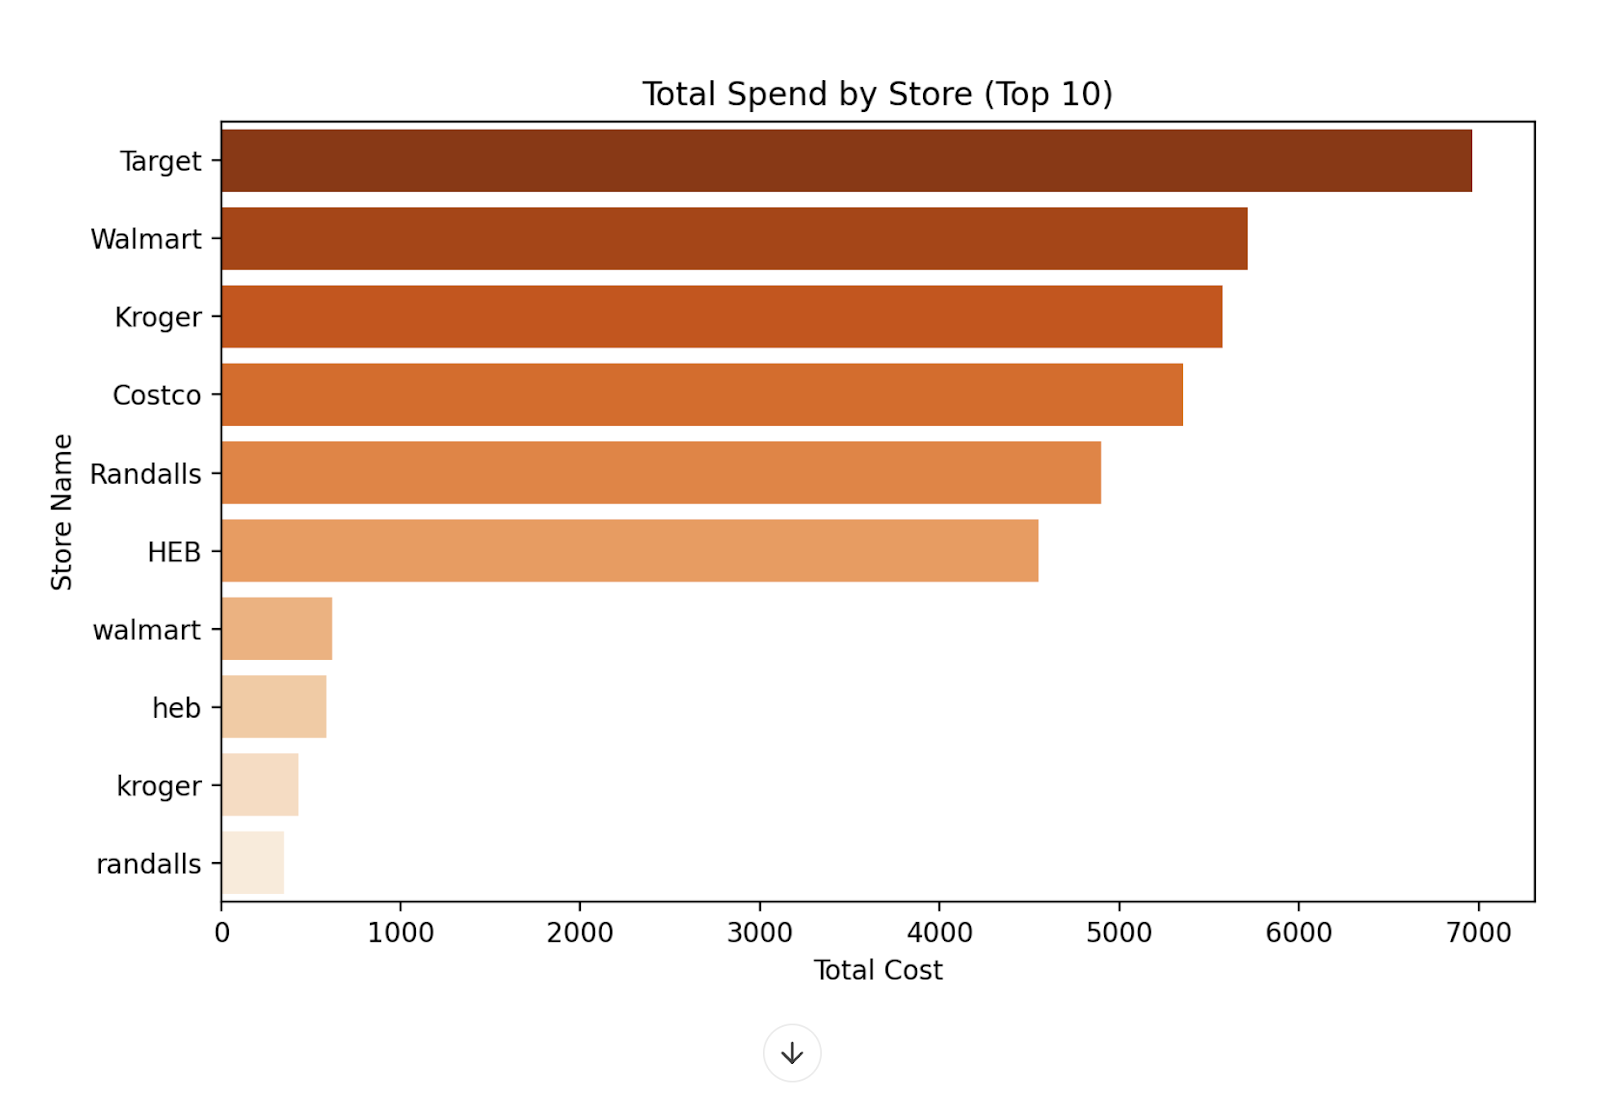
You get the idea. Basically, you can ask anything that helps you find important data points. It’s like chatting with your excel file!
Step 4 - Visualize and act on the insights
Julius turns your data into easy-to-read visuals such as pie charts, bar graphs, and frequency tables so you can spot insights at a glance. It is colorful, clear, and one of the simplest ways to make sense of your numbers.
Prompt:
Tell me how to control the spending and cut on things that are not as necessary as I might think it is.
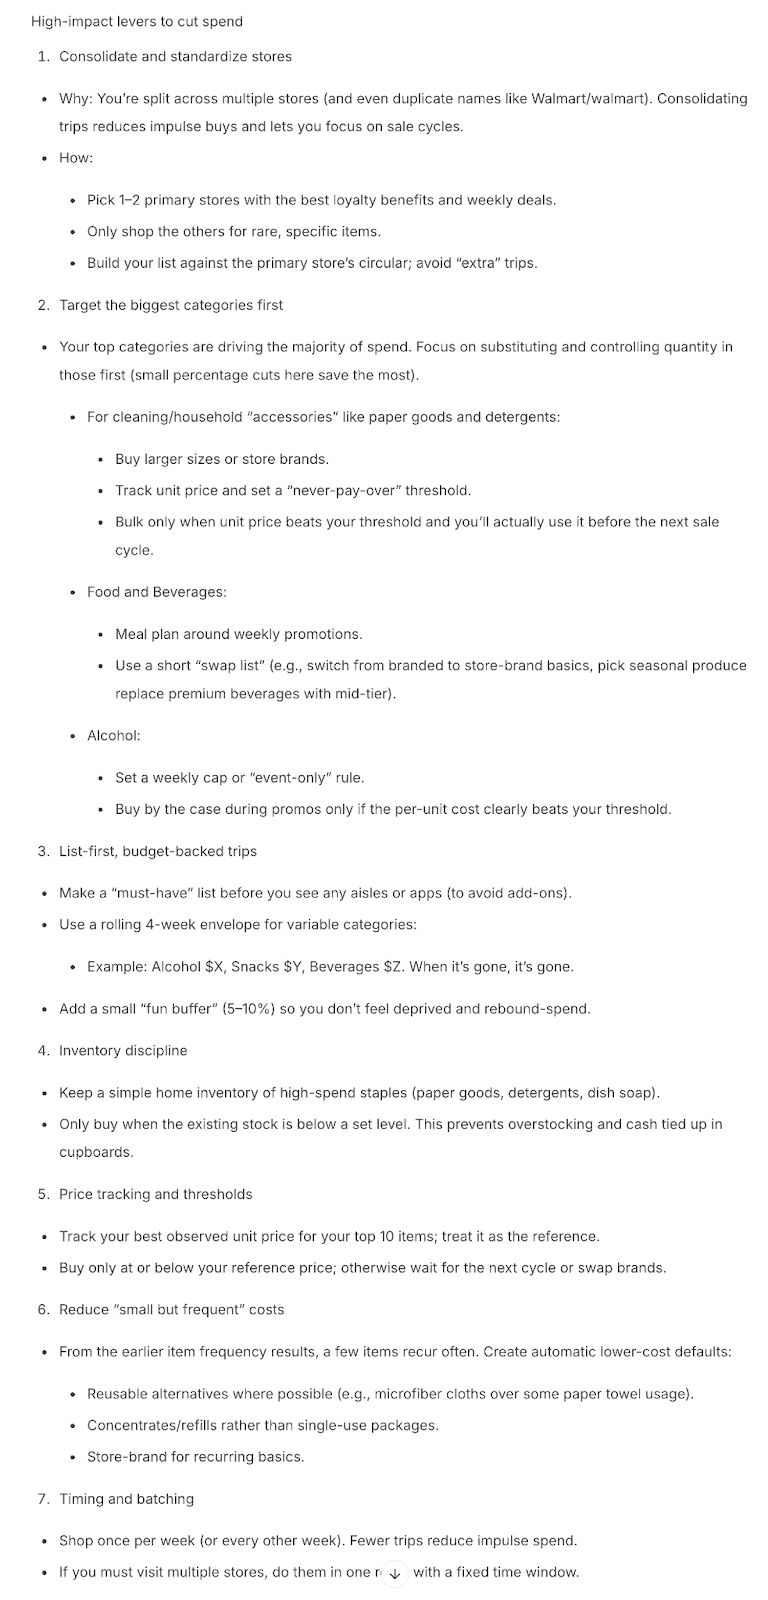
Quick Tip: Run this every month. You will start noticing patterns like rising prices, items worth buying in bulk, or smart swaps you can make. Making decisions based on real data is always more powerful than guessing.
That’s it for this tutorial, AI enthusiasts! If you want to chat with your worksheets, you can use Julius AI to gain rare insights into the data. All it takes is a well-crafted prompt and the desire to dig deeper into the data to find out the real problems.
.png)
.png)